How can I do count_if in R

Dear,

I do a calculation and visualize data in Excel with count_if function, but I don't find a way to do this in R.
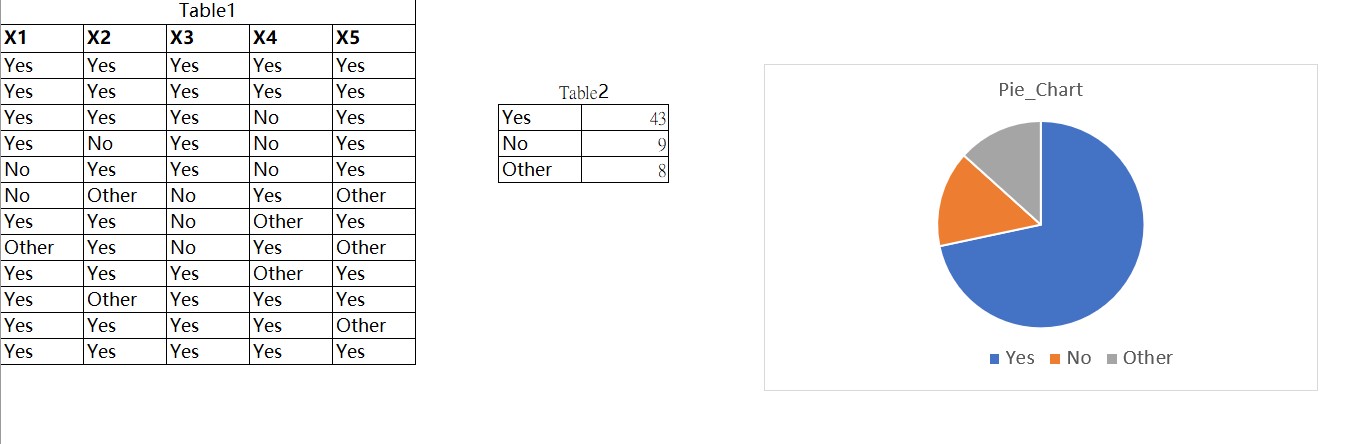
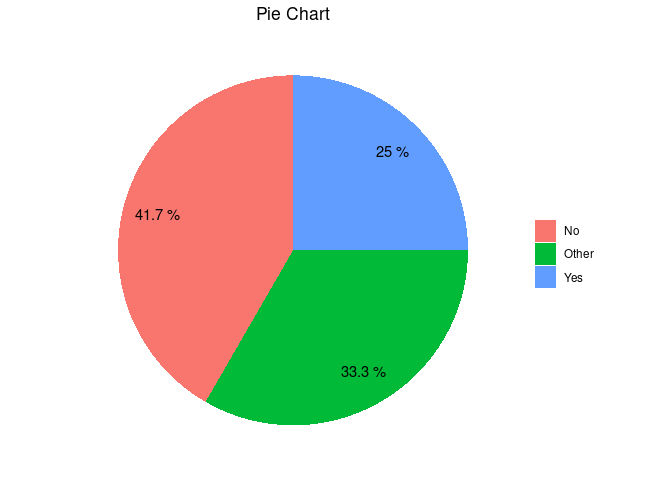
I have a table 1 with the answers, I want to count the total answers and group by category of answer like a table 2, finally make data visualization. All the process like this photos.
Please help find a way to do this in R, thank you

I try to reproducible example, but I don't what is the next steps after create a data frame.

df <- data.frame (
X1 = c ("Yes", "Yes", "No", "Other"),
X2 = c ("Yes", "No", "No", "Other"),
X3 =c ("Other", "No", "No", "Other")
)

Hi!

To help us help you, could you please prepare a reproducible example (reprex) illustrating your issue? Please have a look at this guide, to see how to create one:

Thank you

I will try to edit my post

It's not quite clear what you want to count. If it's the answers in column X1 you could do

library(tidyverse)
df %>% group_by(X1) %>% summarise(count = n())

group_by) makes a group for each unique value in X1. summarise() then computes a statistic for each group.

Dear,

Thank you for your help, I want to count all the answers of all the column and group to new table, like an example I do in Excel, it is not hard to do in Excel when I use count_if and select the ranges and criteria, but I don't know how to write a code in R.

This is a way to do it

library(dplyr)
library(tidyr)
library(ggplot2)

df <- data.frame (
    X1 = c ("Yes", "Yes", "No", "Other"),
    X2 = c ("Yes", "No", "No", "Other"),
    X3 =c ("Other", "No", "No", "Other")
)

(table_2 <- df %>% 
    pivot_longer(cols = everything(),
                 names_to = "column",
                 values_to = "answer") %>% 
    count(answer, name = "count"))
#> # A tibble: 3 × 2
#>   answer count
#>   <chr>  <int>
#> 1 No         5
#> 2 Other      4
#> 3 Yes        3

table_2 %>% 
    ggplot(aes (x = "", y = count, fill = answer)) + 
    geom_col(position = 'stack', width = 1) +
    geom_text(aes(label = paste(round(count / sum(count) * 100, 1), "%"), x = 1.3),
              position = position_stack(vjust = 0.5)) +
    theme_classic() +
    theme(plot.title = element_text(hjust=0.5),
          axis.line = element_blank(),
          axis.text = element_blank(),
          axis.ticks = element_blank()) +
    labs(fill = NULL,
         x = NULL,
         y = NULL,
         title = "Pie Chart") + 
    coord_polar("y")

Created on 2022-08-31 with reprex v2.0.2

1 Like

Dear
Yeah, I got it, thank you so much.

I would use this :

df |> 
  tidyr::gather() |> # pool all columns into one
  dplyr::count(value, name = "count") # count values in this one column, same as previous answer.

PS: there is no direct way to do this because the spreadsheet design is actually not perfect. You usually do not need to count cell over different columns, as different columns should indicate different kind of information. The function gather()indeed clean your data first (telling all columns are actually the same kind of data and should be merged) and then it is easy to count (or do other calculations).

1 Like

Apart from the solutions already given, a very basic and simple approach would be to use

> my.df <- data.frame(X1 = c ("Yes", "Yes", "No", "Other"),
                      X2 = c ("Yes", "No", "No", "Other"),
                      X3 =c ("Other", "No", "No", "Other"))
> table(unlist(my.df))

   No Other   Yes 
    5     4     3 

This topic was automatically closed 21 days after the last reply. New replies are no longer allowed.

If you have a query related to it or one of the replies, start a new topic and refer back with a link.