I want to combine a series of tables while keeping relevant info related to the columns used for the figure. This isn't going in a paper but being shared with collaborators with limited knowledge of R so it doesn't need to be pretty but it needs to be clear. I have used cbind but that combines the columns but with no info of which columns belong to which data. My data looks like the below:
Tone <- c("no", "yes", "no", "yes")
One <- c( "correct", "correct", "correct", "incorrect")
Two <- c("correct", "incorrect", "correct", "incorrect")
Three <- c("incorrect", "incorrect", "correct", "correct")
df <- data.frame(Tone, One, Two, Three)
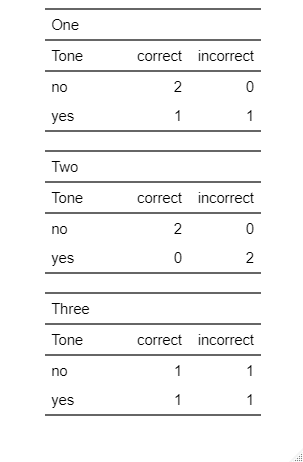
table1 <- table(df$Tone, df$One)
table2 <- table(df$Tone, df$Two)
table3 <- table(df$Tone, df$Three)
Ideally I would have a heading that spanned "correct incorrect" and said "One" and then "Two" and then "Three". I'm open to other ideas for presenting this data though.