How do I create a table in R with conditional formatting and row and column totals?

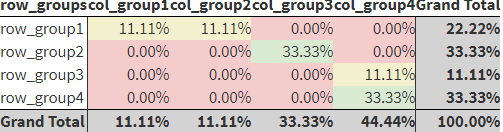
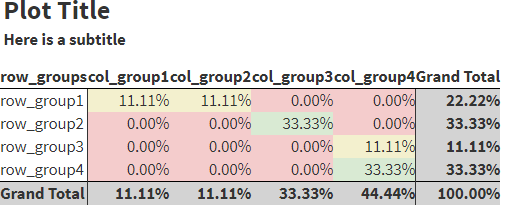
Are there any R packages that I use to replicate or the table below -

image

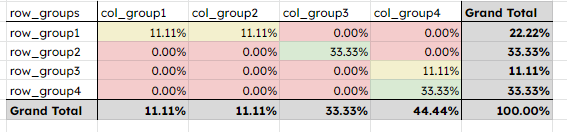
I would like a table with conditional formatting for the table values and row and column grand totals (not conditionally formatted if possible).

The code can be used to reproduce the values in the table along with the row and column grand totals -

library(tidyverse)

# vectors
dates <- rep(date_vec <- c(as.Date("2022-01-01"), as.Date("2022-02-01"), as.Date("2022-03-01")), 30)
row_groups <- c(rep("row_group1", 20), rep("row_group2", 30), rep("row_group3", 10), rep("row_group4", 30))
col_groups <- c(rep("col_group1", 10), rep("col_group2", 10), rep("col_group3", 30), rep("col_group4", 40))


# dataframe
df <- tibble(dates, row_groups, col_groups)

# column grand totals
col_group_total <- df %>% 
    group_by(dates, col_groups) %>% 
    count() %>% 
    group_by(col_groups) %>% 
    summarise(mean = mean(n)) %>% 
    mutate(pct = mean/sum(mean))

# row grand totals
row_group_total <- df %>% 
    group_by(dates, row_groups) %>% 
    count() %>% 
    group_by(row_groups) %>% 
    summarise(mean = mean(n)) %>% 
    mutate(pct = mean/sum(mean))

# table values
group_total <- df %>% 
    group_by(dates, row_groups, col_groups) %>% 
    count() %>% 
    group_by(row_groups, col_groups) %>% 
    summarise(count = mean(n)) %>% 
    ungroup() %>% 
    mutate(pct = count/sum(count))

red_color <- "#f4cccc"
yellow_color <- "#f3f0ce"
green_color <- "#d9ead3"

The kableExtra package was used to recreate the table you shared. Starting with the group_total tibble, I used the pivot_wider() function and janitor package to transform the data into the final format with grand totals.

Next, I created two equally sized tibbles to use in generating the final table.

  • out_numbers formats the numeric values as percentages to two decimal places
  • out_colors replaces each number with one of the color codes provided (set the rules: 0 = red, less than 0.3 = yellow, otherwise green)
# table to plot
out = group_total %>%
  select(-count) %>%
  pivot_wider(names_from = col_groups, values_from = pct) %>%
  mutate_at(2:5, ~replace_na(., 0)) %>%
  janitor::adorn_totals('row', name = 'Grand Total') %>%
  janitor::adorn_totals('col', name = 'Grand Total') 

# format the numbers to 4 digits and percents
out_numbers = out %>%
  mutate_at(2:6, ~format(scales::percent(., accuracy = 0.01), nsmall = 4))

# based on the value of each cell, specifiy a color
out_colors = out %>%
  mutate_at(2:6, 
            ~case_when(. == 0 ~ '#f4cccc',
                       . < 0.3 ~ '#f3f0ce',
                       TRUE ~ '#d9ead3')
            )

out_numbers
#>   row_groups col_group1 col_group2 col_group3 col_group4 Grand Total
#>   row_group1     11.11%     11.11%     0.00%      0.00%      22.22% 
#>   row_group2     0.00%      0.00%      33.33%     0.00%      33.33% 
#>   row_group3     0.00%      0.00%      0.00%      11.11%     11.11% 
#>   row_group4     0.00%      0.00%      0.00%      33.33%     33.33% 
#>  Grand Total     11.11%     11.11%     33.33%     44.44%     100.00%

out_colors
#>   row_groups col_group1 col_group2 col_group3 col_group4 Grand Total
#>   row_group1    #f3f0ce    #f3f0ce    #f4cccc    #f4cccc     #f3f0ce
#>   row_group2    #f4cccc    #f4cccc    #d9ead3    #f4cccc     #d9ead3
#>   row_group3    #f4cccc    #f4cccc    #f4cccc    #f3f0ce     #f3f0ce
#>   row_group4    #f4cccc    #f4cccc    #f4cccc    #d9ead3     #d9ead3
#>  Grand Total    #f3f0ce    #f3f0ce    #d9ead3    #d9ead3     #d9ead3

Starting with the out_numbers tibble, the out_colors tibble sets the background color for each column, and further steps add the shading and borders to the grand total column/row.

library(kableExtra)

# final output
kbl(out_numbers, escape = F, row.names = F, align = 'lrrrrr') %>%
  # set the background colors for column groups
  column_spec(2, background = out_colors$col_group1) %>%
  column_spec(3, background = out_colors$col_group2) %>%
  column_spec(4, background = out_colors$col_group3) %>%
  column_spec(5, background = out_colors$col_group4) %>%
  # set total column background
  column_spec(6, background = 'lightgrey', bold = T) %>%
  # set total row background
  row_spec(5, background = 'lightgrey', bold = T) %>%
  # set borders
  row_spec(c(1, 5), extra_css = 'border-top: 1px solid black;') %>%
  column_spec(c(2, 6), border_left = T)

image

1 Like

@scottyd22 Really interesting solution. Thank you. Is there anyway to add a title and subtitle in kableExtra? I see the option for captions, but don't see one for titles.

Also for anyone interested, see solution from stackoverflow using the gt table package.

Titles and subtitles can be added via the add_header_above() function. Add the following lines to the end of my previous code. The first line is not necessary, but adds the blank space between the subtitle and table.

add_header_above(c('blank' = 6), color = 'white', font_size = 'xx-small', line = F) %>%
add_header_above(c('Here is a subtitle' = 6), align = 'left', line = F) %>%
add_header_above(c('Plot Title' = 6), align = 'left', font_size = 'x-large', line = F)

image

1 Like

This topic was automatically closed 7 days after the last reply. New replies are no longer allowed.

If you have a query related to it or one of the replies, start a new topic and refer back with a link.