Hi, I'm a beginner, thanks to everybody for your help
How do I display the actual values next to the Y axis instead of "0e+00" etc?
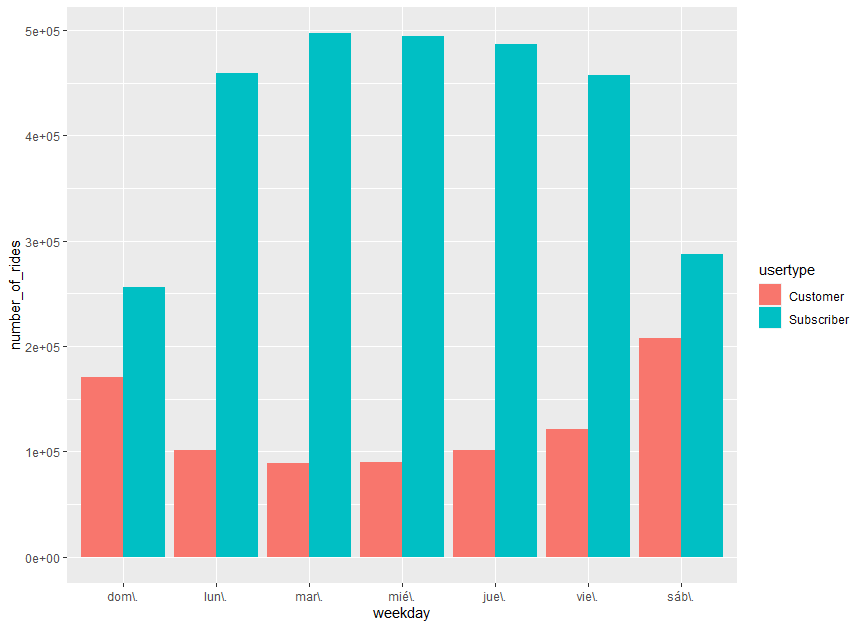
readytable %>%
mutate(weekday = wday(start_time, label = TRUE)) %>%
group_by(usertype, weekday) %>%
summarise(number_of_rides = n()
,average_duration = mean(tripseconds)) %>%
arrange(usertype, weekday) %>%
ggplot(aes(x = weekday, y = number_of_rides, fill = usertype)) +
geom_col(position = "dodge")
Try label_number() from scales package.
Example:
scale_y_continous(labels = label_number())
thanks a lot, it worked perfectly
I added + scale_y_continuous(labels = label_number()) to the code and it fixed it
system
Closed
4
This topic was automatically closed 7 days after the last reply. New replies are no longer allowed.
If you have a query related to it or one of the replies, start a new topic and refer back with a link.