Beats me. It was late when I was doing this and I may have messed up a copy & paste.
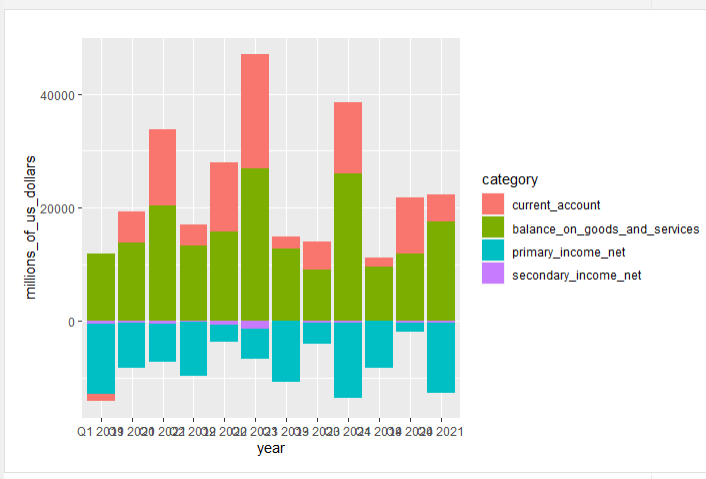
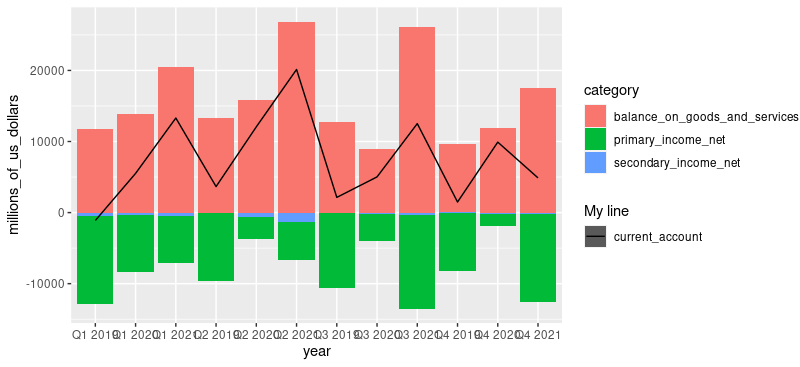
Here is my complete code and a crappy version of the plot. The plot settings need tweaking.
library(tidyverse)
library(plm)
library(reshape2)
library(lubridate)
library(knitr)
library(ggthemes)
library(scales)
library(plyr)
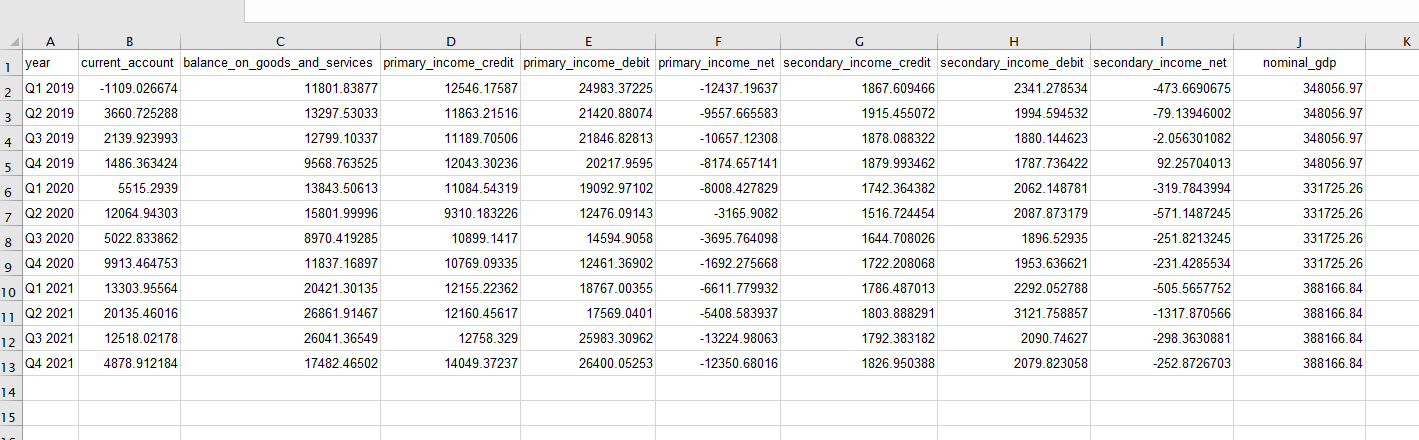
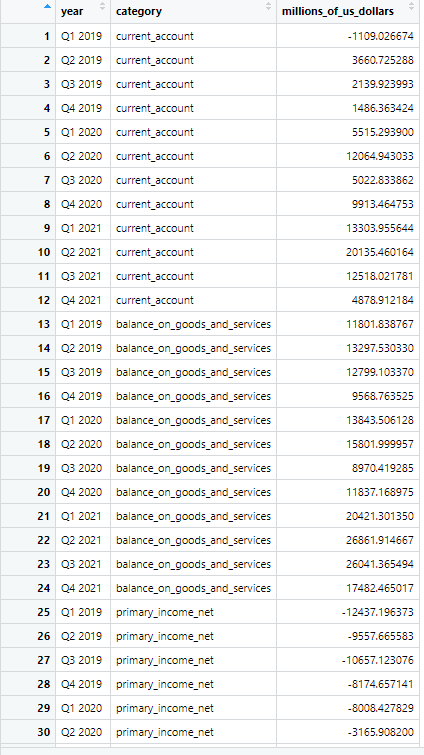
dat1 <- structure(list(year = c("Q1 2019", "Q2 2019", "Q3 2019", "Q4 2019",
"Q1 2020", "Q2 2020", "Q3 2020", "Q4 2020", "Q1 2021", "Q2 2021",
"Q3 2021", "Q4 2021"), current_account = c(-1109.02667393265,
3660.72528764784, 2139.92399300988, 1486.36342433968, 5515.29390026161,
12064.9430330826, 5022.83386227289, 9913.46475323625, 13303.9556437895,
20135.4601644229, 12518.021780825, 4878.9121836567), balance_on_goods_and_services = c(11801.8387671099,
13297.5303303175, 12799.1033701068, 9568.76352533526, 13843.5061283231,
15801.9999571294, 8970.41928486537, 11837.168974812, 20421.3013504932,
26861.9146673647, 26041.3654940305, 17482.4650165682), primary_income_credit = c(12546.1758732497,
11863.2151611759, 11189.7050563377, 12043.3023573049, 11084.5431930097,
9310.18322646373, 10899.1417022828, 10769.0933481838, 12155.2236224838,
12160.4561654009, 12758.3289971177, 14049.3723657532), primary_income_debit = c(24983.3722467487,
21420.8807438295, 21846.8281323522, 20217.9594984319, 19092.9710217002,
12476.0914260247, 14594.905800346, 12461.369016348, 18767.0035539964,
17569.0401021531, 25983.3096222044, 26400.0525283542), primary_income_net = c(-12437.196373499,
-9557.6655826536, -10657.1230760145, -8174.657141127, -8008.4278286905,
-3165.90819956097, -3695.7640980632, -1692.2756681642, -6611.7799315126,
-5408.5839367522, -13224.9806250867, -12350.680162601), secondary_income_credit = c(1867.60946631433,
1915.45507207133, 1878.08832186004, 1879.99346223377, 1742.36438175766,
1516.72445434643, 1644.70802583184, 1722.2080678168, 1786.48701294582,
1803.88829106719, 1792.38318207304, 1826.95038751716), secondary_income_debit = c(2341.27853385782,
1994.59453208744, 1880.14462294237, 1787.73642210234, 2062.1487811286,
2087.87317883227, 1896.52935036112, 1953.63662122838, 2292.05278813689,
3121.75885725675, 2090.7462701918, 2079.82305782767), secondary_income_net = c(-473.66906754349,
-79.13946001611, -2.05630108233004, 92.2570401314301, -319.78439937094,
-571.14872448584, -251.82132452928, -231.42855341158, -505.56577519107,
-1317.87056618956, -298.36308811876, -252.87267031051), nominal_gdp = c(348056.96609927,
348056.96609927, 348056.96609927, 348056.96609927, 331725.264780802,
331725.264780802, 331725.264780802, 331725.264780802, 388166.840809015,
388166.840809015, 388166.840809015, 388166.840809015)), class = c("tbl_df",
"tbl", "data.frame"), row.names = c(NA, -12L))
dat2 <- dat1[, c("year", "current_account", "balance_on_goods_and_services", "primary_income_net","secondary_income_net")]
# change to long form
dat3 <- melt(dat2, id.vars = c("year", "current_account"),
variable.name = "category",
value.name = "millions_of_us_dollars")
pl1 <- ggplot(dat3, aes(fill = category, x = year, y = millions_of_us_dollars))
pl2 <- pl1 + geom_bar(stat = "identity", show.legend = TRUE)
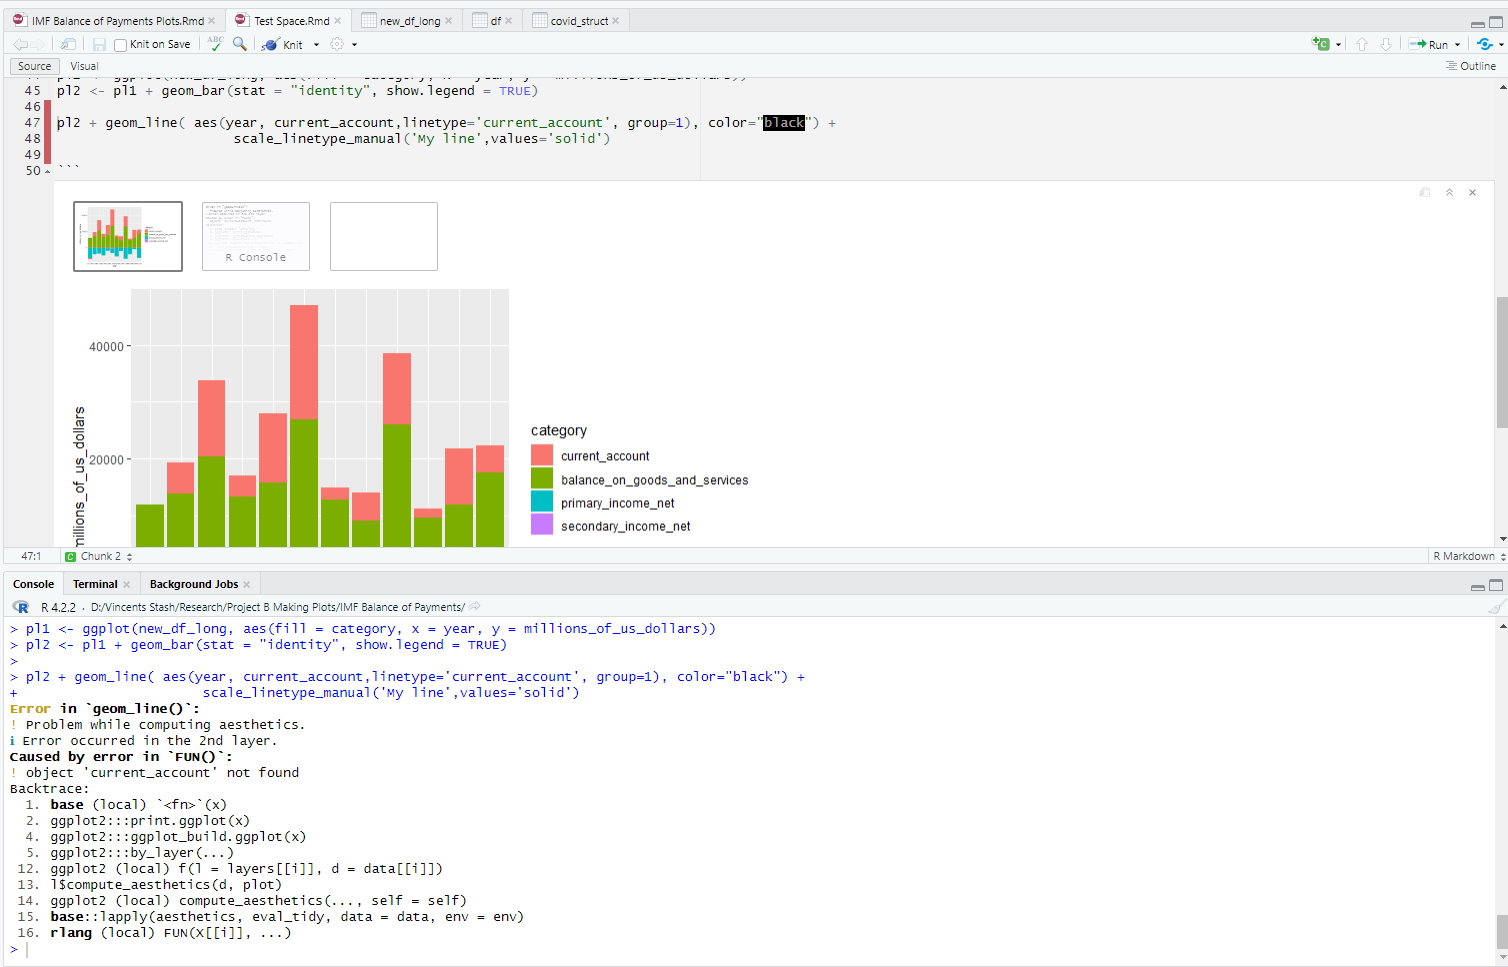
pl2 + geom_line( aes(year, current_account,linetype='current_account', group=1), color="black") +
                      scale_linetype_manual('My line',values='solid')