I am following the code from this website and trying to plot some data on an interactive map using ploty. Difference is I only have data for 6 euro pean countries. Currently the map is plotting for the entire world. How do I adjust the code to zoom in on either all of Europe or just the 6 European countries in the data. See sample code below. The country codes are from this link.
# Libraries
library(tidyverse)
library(plotly)
# Data
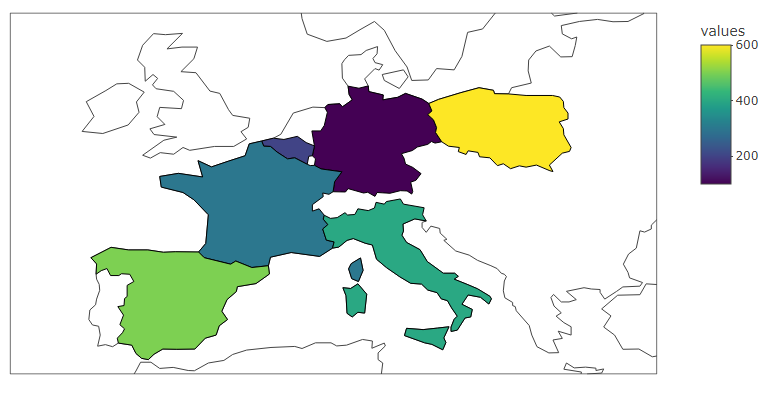
countries <- c("Germany", "Belgium", "Framce", "Italy", "Spain", "Poland")
codes <- c("DEU", "BEL", "FRA", "ITA", "ESP", "POL")
values <- c(100, 200, 300, 400, 500, 600)
df <- tibble(countries, codes, values)
# Maps
plot_geo(locations = df$codes) %>%
add_trace(
z = ~values,
locations = ~codes,
color = ~values
)
You can specify the lat and lon range for the initial zoom using the layout() function.
# Maps
plot_geo(locations = df$codes) %>%
  add_trace(
    z = ~values,
    locations = ~codes,
    color = ~values
  ) %>%
  layout(
    geo = list(lonaxis = list(range = c(-15, 30)),
               lataxis = list(range = c(35, 60))
               )
    )
1 Like
ML_Rookie_2021:
# Data
countries <- c("Germany", "Belgium", "Framce", "Italy", "Spain", "Poland")
codes     <- c("DEU", "BEL", "FRA", "ITA", "ESP", "POL")
values    <- c(100, 200, 300, 400, 500, 600)

df <- tibble(countries, codes, values)

# Maps
plot_geo(locations = df$codes) %>%
    add_trace(
        z = ~values,
        locations = ~codes,
        color = ~values
    )
@scottyd22 Thanks. Can I ask how you figured out the latitude and longitude co-ordinates?
I Google'd "lat lon of europe" and then adjusted from there.
system
November 23, 2022, 1:10pm
5
This topic was automatically closed 7 days after the last reply. New replies are no longer allowed.