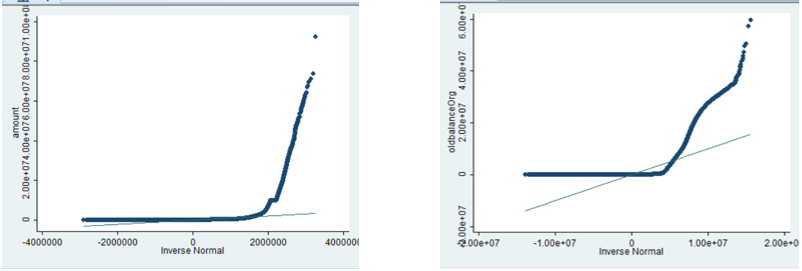
Above is 2 generated Q-Q plot. In terms of skewness, since it concaves upwards, the Q -Q plot designate that the distribution are highly right skewed.
But how do I interpret it in terms of heaviness of tail. Which one has heavier tail?
Also, the moment-based kurtosis() function in R, is it sensitive to outliers? My dataset has many outliers. How do I find a way to determine the heaviness of the tail to know which one has heavier tail.
Thanks
Since there are infinitely many measures of tail heaviness, you need to settle on one definition before comparing data sets in terms of their tail heaviness.
Kurtosis is one measure of tail heaviness. The data set with larger kurtosis has greater tail heaviness (or more precisely, tail leverage) than the other data set.