library(tidyverse)
library(palmerpenguins)
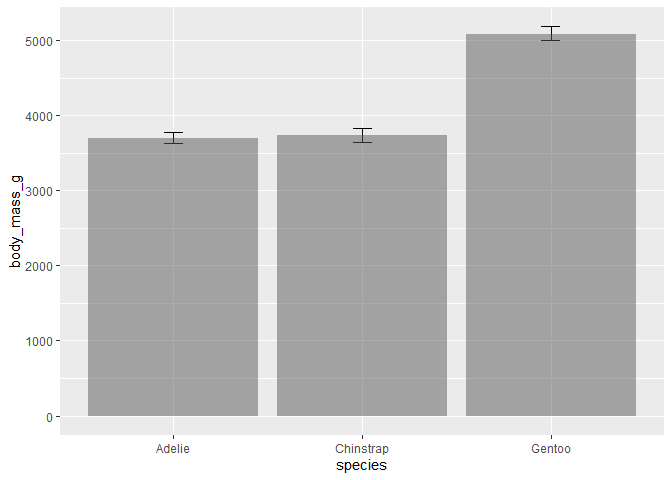
p <- penguins %>%
tidyr::drop_na() %>%
ggplot(aes(x = species, y = body_mass_g)) +
geom_errorbar(stat = "summary",
fun.data = \(x) mean_se(x, 1.96),
width = 0.1) +
expand_limits(y = 0)
p
p +
  geom_bar(stat = "summary", fun.data = \(x) mean(x))
#> Error in `geom_bar()`:
#> ! Problem while setting up geom.
#> ℹ Error occurred in the 3rd layer.
#> Caused by error in `compute_geom_1()`:
#> ! `geom_bar()` requires the following missing aesthetics: y
#> Backtrace:
#>      ▆
#>   1. ├─base::tryCatch(...)
#>   2. │ └─base (local) tryCatchList(expr, classes, parentenv, handlers)
#>   3. │   ├─base (local) tryCatchOne(...)
#>   4. │   │ └─base (local) doTryCatch(return(expr), name, parentenv, handler)
#>   5. │   └─base (local) tryCatchList(expr, names[-nh], parentenv, handlers[-nh])
#>   6. │     └─base (local) tryCatchOne(expr, names, parentenv, handlers[[1L]])
#>   7. │       └─base (local) doTryCatch(return(expr), name, parentenv, handler)
#>   8. ├─base::withCallingHandlers(...)
#>   9. ├─base::saveRDS(...)
#>  10. ├─base::do.call(...)
#>  11. ├─base (local) `<fn>`(...)
#>  12. └─global `<fn>`(input = base::quote("peppy-flea_reprex.R"))
#>  13.   └─rmarkdown::render(input, quiet = TRUE, envir = globalenv(), encoding = "UTF-8")
#>  14.     └─knitr::knit(knit_input, knit_output, envir = envir, quiet = quiet)
#>  15.       └─knitr:::process_file(text, output)
#>  16.         ├─base::withCallingHandlers(...)
#>  17.         ├─knitr:::process_group(group)
#>  18.         └─knitr:::process_group.block(group)
#>  19.           └─knitr:::call_block(x)
#>  20.             └─knitr:::block_exec(params)
#>  21.               └─knitr:::eng_r(options)
#>  22.                 ├─knitr:::in_input_dir(...)
#>  23.                 │ └─knitr:::in_dir(input_dir(), expr)
#>  24.                 └─knitr (local) evaluate(...)
#>  25.                   └─evaluate::evaluate(...)
#>  26.                     └─evaluate:::evaluate_call(...)
#>  27.                       ├─evaluate (local) handle(...)
#>  28.                       │ └─base::try(f, silent = TRUE)
#>  29.                       │   └─base::tryCatch(...)
#>  30.                       │     └─base (local) tryCatchList(expr, classes, parentenv, handlers)
#>  31.                       │       └─base (local) tryCatchOne(expr, names, parentenv, handlers[[1L]])
#>  32.                       │         └─base (local) doTryCatch(return(expr), name, parentenv, handler)
#>  33.                       ├─base::withCallingHandlers(...)
#>  34.                       ├─base::withVisible(value_fun(ev$value, ev$visible))
#>  35.                       └─knitr (local) value_fun(ev$value, ev$visible)
#>  36.                         └─knitr (local) fun(x, options = options)
#>  37.                           ├─base::withVisible(knit_print(x, ...))
#>  38.                           ├─knitr::knit_print(x, ...)
#>  39.                           └─knitr:::knit_print.default(x, ...)
#>  40.                             └─evaluate (local) normal_print(x)
#>  41.                               ├─base::print(x)
#>  42.                               └─ggplot2:::print.ggplot(x)
#>  43.                                 ├─ggplot2::ggplot_build(x)
#>  44.                                 └─ggplot2:::ggplot_build.ggplot(x)
#>  45.                                   └─ggplot2:::by_layer(...)
#>  46.                                     ├─rlang::try_fetch(...)
#>  47.                                     │ ├─base::tryCatch(...)
#>  48.                                     │ │ └─base (local) tryCatchList(expr, classes, parentenv, handlers)
#>  49.                                     │ │   └─base (local) tryCatchOne(expr, names, parentenv, handlers[[1L]])
#>  50.                                     │ │     └─base (local) doTryCatch(return(expr), name, parentenv, handler)
#>  51.                                     │ └─base::withCallingHandlers(...)
#>  52.                                     └─ggplot2 (local) f(l = layers[[i]], d = data[[i]])
#>  53.                                       └─l$compute_geom_1(d)
#>  54.                                         └─ggplot2 (local) compute_geom_1(..., self = self)
#>  55.                                           └─ggplot2:::check_required_aesthetics(...)
#>  56.                                             └─cli::cli_abort(message, call = call)
#>  57.                                               └─rlang::abort(...)
Created on 2023-05-25 with reprex v2.0.2