How to add a selection tab to list all variables in R shiny to plot boxplot?

Hi,

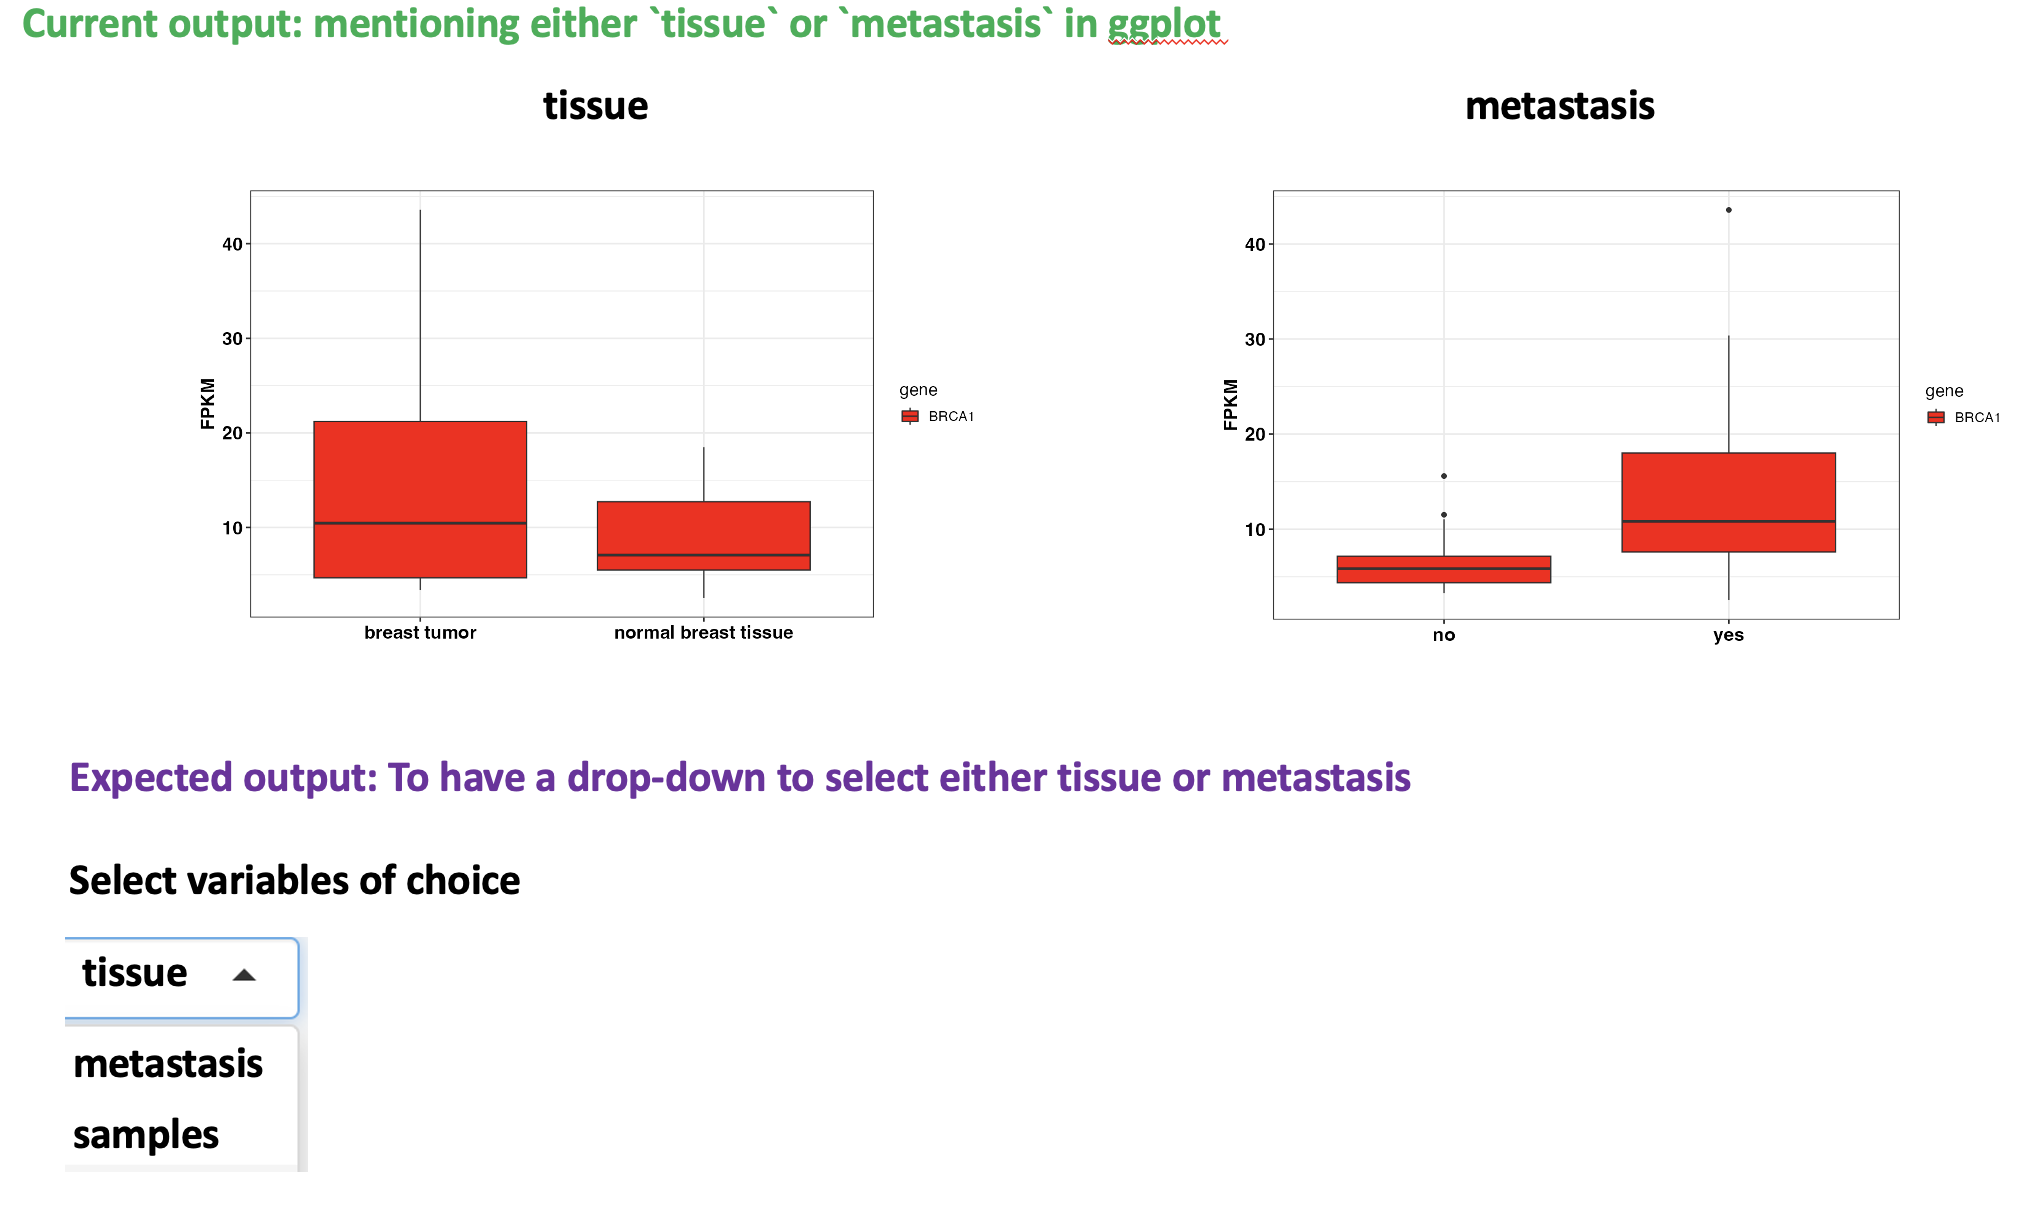
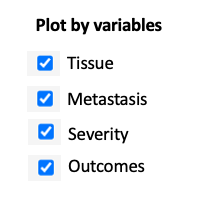
I have a question about adding a selection tab to list all available variables (columns) in R shiny to plot boxplot. At the moment I have to explicitly specify in the ggplot2 aesthetics the variable I am interested one by one (for instance, see the screenshot below: first for the tissue and then for the metastasis, etc., ). Having the selection tab in the way of drop-down like selecting the variables would be helpful.

# Data for plotting
dput(custom_data)
structure(list(gene = c("BRCA1", "BRCA1", "BRCA1", "BRCA1", "BRCA1", 
                        "BRCA1", "BRCA1", "BRCA1", "BRCA1", "BRCA1", "BRCA1", "BRCA1", 
                        "BRCA1", "BRCA1", "BRCA1", "BRCA1", "BRCA1", "BRCA1", "BRCA1", 
                        "BRCA1", "BRCA2", "BRCA2", "BRCA2", "BRCA2", "BRCA2", "BRCA2", 
                        "BRCA2", "BRCA2", "BRCA2", "BRCA2", "BRCA2", "BRCA2", "BRCA2", 
                        "BRCA2", "BRCA2", "BRCA2", "BRCA2", "BRCA2", "BRCA2", "BRCA2", 
                        "BRCA3", "BRCA3", "BRCA3", "BRCA3", "BRCA3", "BRCA3", "BRCA3", 
                        "BRCA3", "BRCA3", "BRCA3", "BRCA1", "BRCA1", "BRCA1", "BRCA1", 
                        "BRCA1", "BRCA1", "BRCA1", "BRCA1", "BRCA1", "BRCA1"), samples = c("CA.102548", 
                                                                                           "CA.104338", "CA.105094", "CA.109745", "CA.1906415", "CA.1912627", 
                                                                                           "CA.1924346", "CA.1926760", "CA.1927842", "CA.1933414", "CAP.102548", 
                                                                                           "CAP.104338", "CAP.105094", "CAP.109745", "CAP.1906415", "CAP.1912627", 
                                                                                           "CAP.1924346", "CAP.1926760", "CAP.1927842", "CAP.1933414", "CA.102548", 
                                                                                           "CA.104338", "CA.105094", "CA.109745", "CA.1906415", "CA.1912627", 
                                                                                           "CA.1924346", "CA.1926760", "CA.1927842", "CA.1933414", "CAP.102548", 
                                                                                           "CAP.104338", "CAP.105094", "CAP.109745", "CAP.1906415", "CAP.1912627", 
                                                                                           "CAP.1924346", "CAP.1926760", "CAP.1927842", "CAP.1933414", "CA.1940640", 
                                                                                           "CA.2004407", "CA.2005288", "CA.2006047", "CA.2008260", "CA.2009329", 
                                                                                           "CA.2009381", "CA.2009850", "CA.2017611", "CA.2039179", "CAP.1940640", 
                                                                                           "CAP.2004407", "CAP.2005288", "CAP.2006047", "CAP.2008260", "CAP.2009329", 
                                                                                           "CAP.2009381", "CAP.2009850", "CAP.2017611", "CAP.2039179"), 
               FPKM = c(30.37, 24.43, 43.58, 11.05, 3.38, 5.96, 4.26, 11.52, 
                        9.87, 3.47, 15.91, 7.86, 8.58, 7.23, 5.43, 16.01, 3.29, 6.94, 
                        9.86, 4.71, 0.38, 0.23, 0, 1.31, 0.53, 3.37, 1.21, 4.39, 
                        3.91, 3.51, 9.28, 1.25, 2.61, 1.25, 0.31, 10.13, 0.54, 1.26, 
                        6.39, 1.68, 11.28, 6.63, 5.46, 5.4, 14.64, 6.91, 9.49, 10, 
                        3.85, 4.11, 17.85, 5.52, 6.32, 11.78, 15.59, 2.54, 6.19, 
                        4.59, 18.49, 6.86), tissue = c("breast tumor", "breast tumor", 
                                                       "breast tumor", "breast tumor", "breast tumor", "breast tumor", 
                                                       "breast tumor", "breast tumor", "breast tumor", "breast tumor", 
                                                       "normal breast tissue", "normal breast tissue", "normal breast tissue", 
                                                       "normal breast tissue", "normal breast tissue", "normal breast tissue", 
                                                       "normal breast tissue", "normal breast tissue", "normal breast tissue", 
                                                       "normal breast tissue", "breast tumor", "breast tumor", "breast tumor", 
                                                       "breast tumor", "breast tumor", "breast tumor", "breast tumor", 
                                                       "breast tumor", "breast tumor", "breast tumor", "normal breast tissue", 
                                                       "normal breast tissue", "normal breast tissue", "normal breast tissue", 
                                                       "normal breast tissue", "normal breast tissue", "normal breast tissue", 
                                                       "normal breast tissue", "normal breast tissue", "normal breast tissue", 
                                                       "breast tumor", "breast tumor", "breast tumor", "breast tumor", 
                                                       "breast tumor", "breast tumor", "breast tumor", "breast tumor", 
                                                       "breast tumor", "breast tumor", "normal breast tissue", "normal breast tissue", 
                                                       "normal breast tissue", "normal breast tissue", "normal breast tissue", 
                                                       "normal breast tissue", "normal breast tissue", "normal breast tissue", 
                                                       "normal breast tissue", "normal breast tissue"), metastasis = c("yes", 
                                                                                                                       "yes", "yes", "no", "no", "yes", "no", "no", "yes", "no", 
                                                                                                                       "yes", "yes", "yes", "no", "no", "yes", "no", "no", "yes", 
                                                                                                                       "no", "yes", "yes", "yes", "no", "no", "yes", "no", "no", 
                                                                                                                       "yes", "no", "yes", "yes", "yes", "no", "no", "yes", "no", 
                                                                                                                       "no", "yes", "no", "yes", "no", "no", "yes", "no", "yes", 
                                                                                                                       "no", "yes", "yes", "yes", "yes", "no", "no", "yes", "no", 
                                                                                                                       "yes", "no", "yes", "yes", "yes")), class = "data.frame", row.names = c(NA, 
                                                                                                                                                                                               -60L))

# Plot box plot
library(shiny)
library(ggplot2)
library(ggpubr)

ui <- fluidPage(
  sidebarLayout(
    sidebarPanel(
      selectInput("thegene", "Gene", choices = c("BRCA1", "BRCA2", "BRCA3"), selected = "BRCA1"),
      radioButtons("colour","Colour of histogram",choices=c("red","green","blue"),selected="red"),
      width = 3
    ),
    mainPanel(
      plotOutput("boxplot"),
      width = 9
    )
  )
)

server <- function(input, output, session) {
  
  alldat <- reactive({
    choices <- unique(custom_data$gene)
    selected <- isolate(input$thegene)
    if (!selected %in% choices) selected <- choices[1]
    updateSelectInput(session, "thegene", choices = choices, selected = selected)
    custom_data
  })
  
  dat <- reactive({
    x <- alldat()
    x[ x$gene == input$thegene,,drop=FALSE]
  })
  
  output$boxplot <- renderPlot({
    ggplot(data = dat(), aes(x = tissue, y = FPKM, fill = gene)) +
      geom_boxplot() +
      theme_bw(base_size = 14) + xlab("") + ylab("FPKM") +
      theme(axis.text=element_text(size=15, face = "bold", color = "black"),
            axis.title=element_text(size=15, face = "bold", color = "black"),
            strip.text = element_text(size=15, face = "bold", color = "black")) +
      scale_fill_manual(values = input$colour)
  })
  
}

1 Like

If I'm understanding correctly, I added a dropdown input for selecting "tissue" or "metastasis", which filters the dat() reactive and drives the title of the plot. Is this what you had in mind?

ui <- fluidPage(
  sidebarLayout(
    sidebarPanel(
      selectInput("thegene", "Gene", choices = c("BRCA1", "BRCA2", "BRCA3"), selected = "BRCA1"),
      radioButtons("colour","Colour of histogram",choices=c("red","green","blue"),selected="red"),
      selectInput('type', 'Select one', choices = c('tissue', 'metastasis'), selected = 'tissue'),
      width = 3
    ),
    mainPanel(
      plotOutput("boxplot"),
      width = 9
    )
  )
)

server <- function(input, output, session) {
  
  dat <- reactive({
    custom_data |> 
      pivot_longer(cols = c('tissue', 'metastasis'), names_to = 'type') |>
      filter(type == input$type) |>
      filter(gene == input$thegene)
  })
  
  output$boxplot <- renderPlot({
    ggplot(data = dat(), aes(x = value, y = FPKM, fill = gene)) +
      geom_boxplot() +
      theme_bw(base_size = 14) + 
      labs(x = "", y = "FPKM", title = str_to_title(input$type)) +
      theme(axis.text=element_text(size=15, face = "bold", color = "black"),
            axis.title=element_text(size=15, face = "bold", color = "black"),
            plot.title = element_text(size=15, face = "bold", color = "black")) +
      scale_fill_manual(values = input$colour)
  })
  
}

shinyApp(ui = ui, server = server)

1 Like

@scottyd22 thank you very much. This is what I expected as output.

Just checking if there is a possibility to mix or view both the variables in the same plot as below screenshot. In my previous example code, I modified ggplot(data = dat(), aes(x = tissue, y = FPKM, color = metastasis)).

I just changed in the ggplot
fill = gene
to
color = metastasis

Yes, that is one way to do it. This would eliminate the need for the tissue/metastasis dropdown.

@scottyd22 thanks. I don't want to eliminate the tissue/metastasis dropdown as it is very important. I was exploring if there is a way in a shiny app to add another dropdown or a button to select/plot by tissue and metastasis in a single plot as displayed above.

Below is one way to achieve this using a checkboxInput.

ui <- fluidPage(
  sidebarLayout(
    sidebarPanel(
      selectInput("thegene", "Gene", choices = c("BRCA1", "BRCA2", "BRCA3"), selected = "BRCA1"),
      radioButtons("colour","Colour of histogram",choices=c("red","green","blue"),selected="red"),
      selectInput('type', 'Select one', choices = c('tissue', 'metastasis'), selected = 'tissue'),
      checkboxInput('plotby', 'Plot by tissue and metastatis?', value = F),
      width = 3
    ),
    mainPanel(
      plotOutput("boxplot"),
      width = 9
    )
  )
)

server <- function(input, output, session) {
  
  dat <- reactive({
    
    if(input$plotby == F) {
      custom_data |> 
        filter(gene == input$thegene) |>
        pivot_longer(cols = c('tissue', 'metastasis'), names_to = 'type') |>
        filter(type == input$type) 
    } else {
      custom_data |>
        filter(gene == input$thegene) |>
        mutate(value = tissue)
    }
    
  })
  
  output$boxplot <- renderPlot({
    
    g = ggplot(data = dat(), aes(x = value, y = FPKM, fill = gene)) +
      scale_fill_manual(values = input$colour)
    
    Title = str_to_title(input$type)
    
    if(input$plotby == T) {
      g = ggplot(data = dat(), aes(x = value, y = FPKM, color = metastasis))
      
      Title = 'Tissue and Metastasis'
    }
    
    g +
      geom_boxplot() +
      theme_bw(base_size = 14) + 
      labs(x = "", y = "FPKM", title = Title) +
      theme(axis.text=element_text(size=15, face = "bold", color = "black"),
            axis.title=element_text(size=15, face = "bold", color = "black"),
            plot.title = element_text(size=15, face = "bold", color = "black")) 
  })
  
}

shinyApp(ui = ui, server = server)

1 Like

@scottyd22 thank you very much for your time and continuous support. Much appreciated. This feature is very helpful. This was the feature that I was looking to cross-compare variables. This is a good use case for Bioinformatician too in their data analysis work.

Maybe a suggestion and thought was to have multi-checkbox (see below) instead of one combined checkboxes for multiple variables because each dataset would different some could be simple variable experiment, and some complex multiple variables set-up. Having the checkbox for each variable would be flexible and more convenient for user. In the meantime, let me also try If I get any success on this.

1 Like

This topic was automatically closed 7 days after the last reply. New replies are no longer allowed.

If you have a query related to it or one of the replies, start a new topic and refer back with a link.