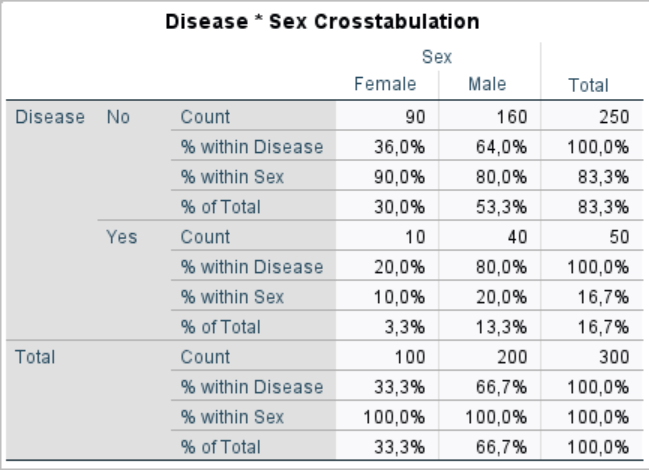
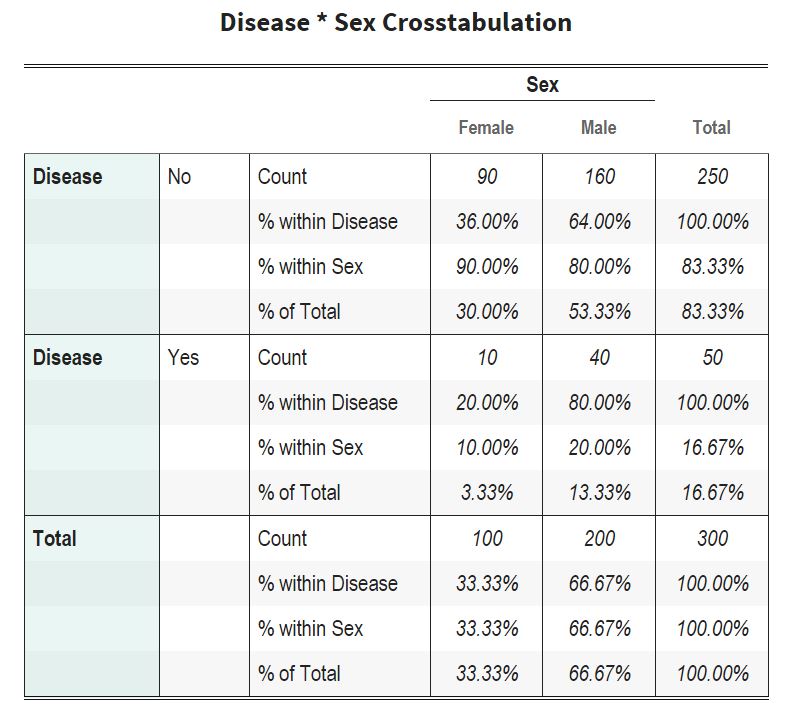
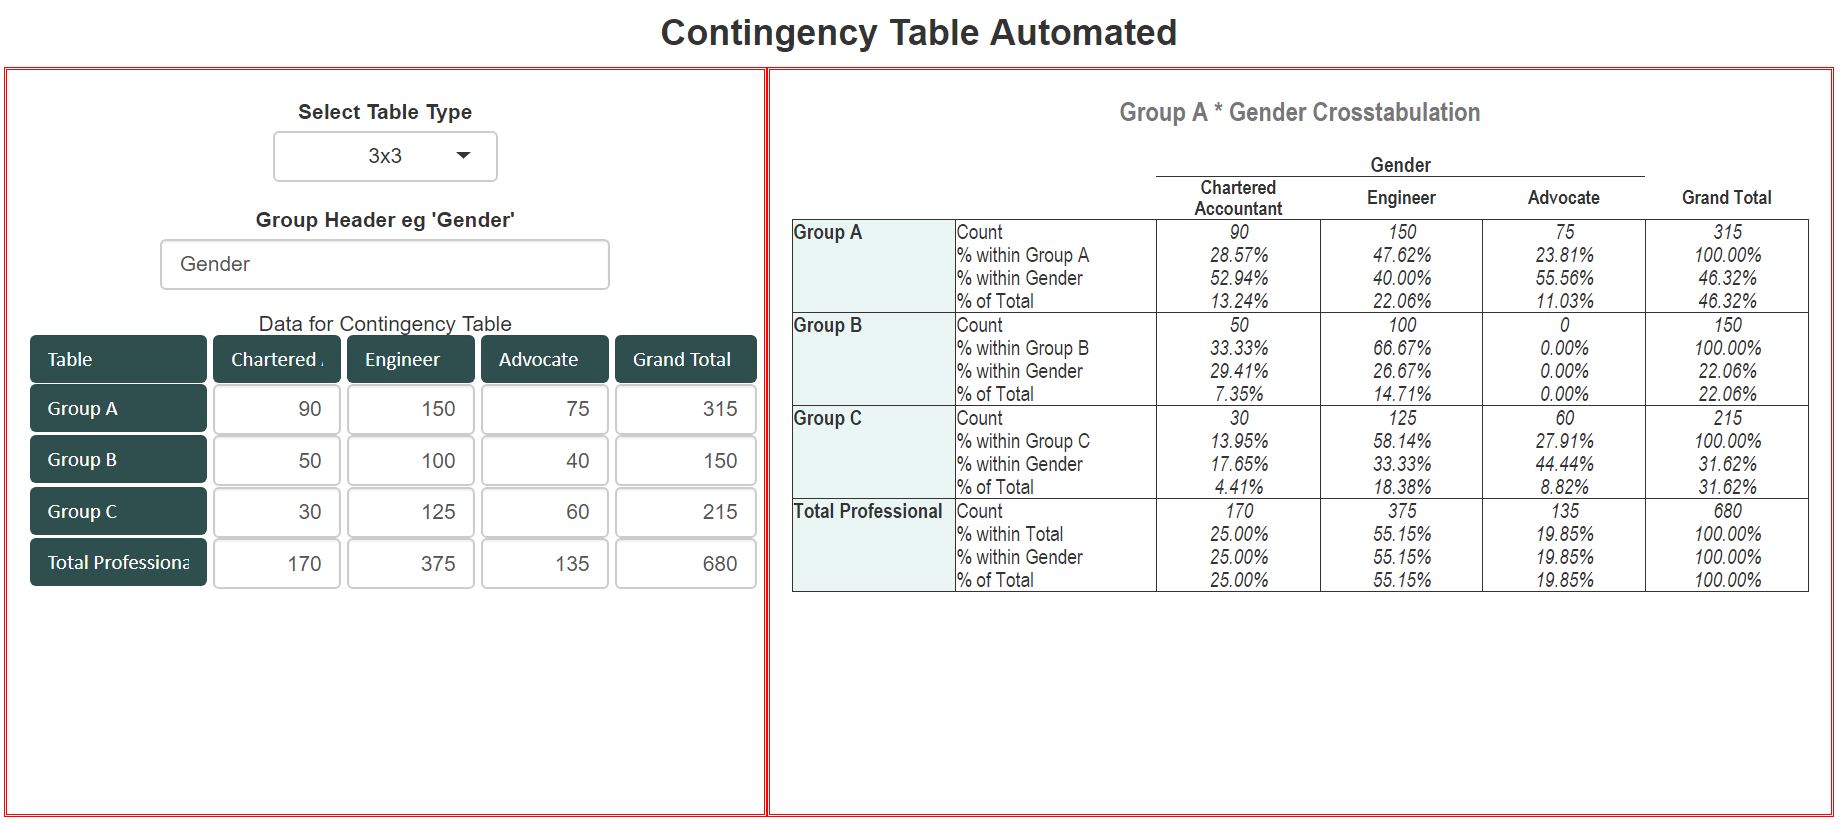
Hi Andrzej, finally done, fully automated for 2x2, 2x3, 3x2, and 3x3 contingency tables
Please note column and row headers having dark green backgrounds are all fully editable, it will reflect immediately on the Table. lengthier heading will be wrapped automatically. Fully automated, it has come very well , hope works for you as well
#######################################
# Loading Libraries
#######################################
library(shiny)
library(shinydashboard)
library(shinyjs)
library(stringr)
library(shinyWidgets)
library(dplyr)
library(kableExtra)

#######################################
# function for percentage with decimals
#######################################
fnpercent <- function(x, digits = 2, format = "f", ...) {      # Create user-defined function
  paste0(formatC(x * 100, format = format, digits = digits, ...), "%")
}


#######################################
# Dashboard UI
#######################################
ui <- fluidPage(
  # Coloring textInput box    #where you got:https://stackoverflow.com/questions/47478123/how-to-change-background-color-for-textInput-in-r-shiny
  tags$head(tags$style(HTML('
   #mRow0name, #mRow1name, #mRow2name, #mRow3name, #mRow4name,#mcol1name,#mcol2name,
   #mcol3name,#mcol4name{
     color:white; font-size:14px;
     font-family: Calibri;
     font-weight: normal;
     background-color: #2f4f4f !important;
     border: 2px double black;border-style:solid;
     height: 32px;
     overflow-y:none;
     border: none;
   }'))),

  column(
    width = 12,
    align='center',
    div(style = "margin-top:20px"),
    HTML(paste('<h3><b>','Contingency Table Automated','</b><h5>')),
    column(style = "border: 2px double red;height: 500px;overflow-y: auto;",
           width = 5,
           align = 'center',
           div(style = "margin-top:20px"),

           selectInput(
             inputId = "mTableTypeChk",
             label = 'Select Table Type',
             choices = c('2x2','2x3','3x2','3x3'),
             selected = '2x2',
             width = '150px',
             multiple = F
           ),
      textInput(inputId = 'mgrptitle',label = "Group Header eg 'Gender'",value = 'Gender'),

      HTML('Data for Contingency Table'),
      splitLayout(cellWidths = c('25%','18%','18%','18%','20%'),
                  textInput(inputId = 'mRow0name',label = NULL,value = 'Table'),
                  textInput(inputId = 'mcol1name',label = NULL,value = 'Column1'),
                  textInput(inputId = 'mcol2name',label = NULL,value = 'Column2'),
                  textInput(inputId = 'mcol3name',label = NULL,value = 'Column3'),
                  textInput(inputId = 'mcol4name',label = NULL,value = 'Total')
                  ),
      div(style = "margin-top:-15px"),
      splitLayout(cellWidths = c('25%','18%','18%','18%','20%'),
                  textInput(inputId = 'mRow1name',label = NULL,value = 'Row1'),
                  shinyWidgets::autonumericInput(inputId = "mValC11",label = NULL,value = 90,digitGroupSeparator = ",", decimalPlaces = 0),
                  shinyWidgets::autonumericInput(inputId = "mValC12",label = NULL,value = 160,digitGroupSeparator = ",", decimalPlaces = 0),
                  shinyWidgets::autonumericInput(inputId = "mValC13",label = NULL,value = 90,digitGroupSeparator = ",", decimalPlaces = 0),
                  shinyWidgets::autonumericInput(inputId = "mValC14",label = NULL,value = 90,digitGroupSeparator = ",", decimalPlaces = 0)


      ),
      div(style = "margin-top:-15px"),
      splitLayout(cellWidths = c('25%','18%','18%','18%','20%'),
                  textInput(inputId = 'mRow2name',label = NULL,value = 'Row2'),
                  shinyWidgets::autonumericInput(inputId = "mValC21",label = NULL,value = 10,digitGroupSeparator = ",", decimalPlaces = 0),
                  shinyWidgets::autonumericInput(inputId = "mValC22",label = NULL,value = 40,digitGroupSeparator = ",", decimalPlaces = 0),
                  shinyWidgets::autonumericInput(inputId = "mValC23",label = NULL,value = 10,digitGroupSeparator = ",", decimalPlaces = 0),
                  shinyWidgets::autonumericInput(inputId = "mValC24",label = NULL,value = 10,digitGroupSeparator = ",", decimalPlaces = 0)
      ),
      div(style = "margin-top:-15px"),
      splitLayout(cellWidths = c('25%','18%','18%','18%','20%'),
                  textInput(inputId = 'mRow3name',label = NULL,value = 'Row3'),
                  shinyWidgets::autonumericInput(inputId = "mValC31",label = NULL,value = 10,digitGroupSeparator = ",", decimalPlaces = 0),
                  shinyWidgets::autonumericInput(inputId = "mValC32",label = NULL,value = 40,digitGroupSeparator = ",", decimalPlaces = 0),
                  shinyWidgets::autonumericInput(inputId = "mValC33",label = NULL,value = 10,digitGroupSeparator = ",", decimalPlaces = 0),
                  shinyWidgets::autonumericInput(inputId = "mValC34",label = NULL,value = 10,digitGroupSeparator = ",", decimalPlaces = 0)

      ),
      div(style = "margin-top:-15px"),
      splitLayout(cellWidths = c('25%','18%','18%','18%','20%'),
                  textInput(inputId = 'mRow4name',label = NULL,value = 'Total'),
                  shinyWidgets::autonumericInput(inputId = "mValC41",label = NULL,value = 10,digitGroupSeparator = ",", decimalPlaces = 0),
                  shinyWidgets::autonumericInput(inputId = "mValC42",label = NULL,value = 40,digitGroupSeparator = ",", decimalPlaces = 0),
                  shinyWidgets::autonumericInput(inputId = "mValC43",label = NULL,value = 10,digitGroupSeparator = ",", decimalPlaces = 0),
                  shinyWidgets::autonumericInput(inputId = "mValC44",label = NULL,value = 10,digitGroupSeparator = ",", decimalPlaces = 0)

      )
    ),
    column(style = "border: 2px double red;height: 500px;overflow-y: auto;",
           width = 7,
           align = 'center',
      htmlOutput('mshowmatrixtbl')
    )

  ) #fluidrow closure
)

server <- function(input, output, session) {

  #####################################################
  # finally call function for contingency table
  #####################################################
  observeEvent(
    c(input$mTableTypeChk,
      input$mgrptitle,
      input$mRow1name,
      input$mRow2name,
      input$mRow3name,
      input$mRow4name,
      input$mValC11,
      input$mValC12,
      input$mValC13,
      input$mValC21,
      input$mValC22,
      input$mValC23,
      input$mValC31,
      input$mValC32,
      input$mValC33,
      input$mValC14,
      input$mValC24,
      input$mValC34,
      input$mValC41,
      input$mValC42,
      input$mValC43,
      input$mValC44),{
        req(input$mgrptitle)
        req(input$mValC11)
        req(input$mValC12)
        req(input$mValC13)
        req(input$mValC21)
        req(input$mValC22)
        req(input$mValC23)
        req(input$mValC31)
        req(input$mValC32)
        req(input$mValC33)

        observeEvent(input$mTableTypeChk,{
          if(input$mTableTypeChk=='2x2'){
            shinyWidgets::updateAutonumericInput(session,inputId = 'mValC13',value = 0)
            shinyWidgets::updateAutonumericInput(session,inputId = 'mValC23',value = 0)
            shinyWidgets::updateAutonumericInput(session,inputId = 'mValC33',value = 0)

            shinyWidgets::updateAutonumericInput(session,inputId = 'mValC31',value = 0)
            shinyWidgets::updateAutonumericInput(session,inputId = 'mValC32',value = 0)
            shinyWidgets::updateAutonumericInput(session,inputId = 'mValC33',value = 0)
          }else if(input$mTableTypeChk=='2x3'){
            shinyWidgets::updateAutonumericInput(session,inputId = 'mValC31',value = 0)
            shinyWidgets::updateAutonumericInput(session,inputId = 'mValC32',value = 0)
            shinyWidgets::updateAutonumericInput(session,inputId = 'mValC33',value = 0)
          }else if(input$mTableTypeChk=='3x2'){
            shinyWidgets::updateAutonumericInput(session,inputId = 'mValC13',value = 0)
            shinyWidgets::updateAutonumericInput(session,inputId = 'mValC23',value = 0)
            shinyWidgets::updateAutonumericInput(session,inputId = 'mValC33',value = 0)
          }
        })


        shinyWidgets::updateAutonumericInput(session,inputId = 'mValC14',value = (input$mValC11+input$mValC12+input$mValC13))
        shinyWidgets::updateAutonumericInput(session,inputId = 'mValC24',value = (input$mValC21+input$mValC22+input$mValC23))
        shinyWidgets::updateAutonumericInput(session,inputId = 'mValC34',value = (input$mValC31+input$mValC32+input$mValC33))

        shinyWidgets::updateAutonumericInput(session,inputId = 'mValC41',value = (input$mValC11+input$mValC21+input$mValC31))
        shinyWidgets::updateAutonumericInput(session,inputId = 'mValC42',value = (input$mValC12+input$mValC22+input$mValC32))
        shinyWidgets::updateAutonumericInput(session,inputId = 'mValC43',value = (input$mValC13+input$mValC23+input$mValC33))
        shinyWidgets::updateAutonumericInput(session,inputId = 'mValC44',value = (input$mValC11+input$mValC21+input$mValC31+input$mValC12+input$mValC22+input$mValC32+input$mValC13+input$mValC23+input$mValC33))


        df <- fnCreateTemporyTbl(mRow1name= input$mRow1name,mRow2name= input$mRow2name,mRow3name= input$mRow3name,mRow4name= input$mRow4name,mgrptitle= input$mgrptitle,mcol1name= input$mcol1name,mcol2name= input$mcol2name,mcol3name= input$mcol3name)
        df <- data.frame(fnUpdateTemporyTbl(
          df=df,
          mValC11 = input$mValC11,mValC12 = input$mValC12,mValC13 = input$mValC13,
          mValC21 = input$mValC21,mValC22 = input$mValC22,mValC23 = input$mValC23,
          mValC31 = input$mValC31,mValC32 = input$mValC32,mValC33 = input$mValC33))

  #########################################################################
  # depending on your Contingency table type whether2x2 or 2x3 or 3x2, 3x3
  # This code will delete unwanted coumn and rows as NA
  # and then next two lines will delete ALL NA rows and ALL NA columns
  #########################################################################

          if(input$mTableTypeChk=='2x2'){
            df[c(9:12),] <- NA
            df[,5]       <- NA
          }else if(input$mTableTypeChk=='2x3'){
            df[c(9:12),] <- NA
          }else if(input$mTableTypeChk=='3x2'){
            df[,5]       <- NA
          }

        df <-df[rowSums(is.na(df)) != ncol(df), ]        # Drop empty rows
        df <- df[ , colSums(is.na(df)) != nrow(df)]       # Drop empty columns

        output$mshowmatrixtbl <- renderUI({
          if(substr(input$mTableTypeChk,3,3)=='2'){
              HTML(fnGenerateKblTbl2columns(df=df,mRow1name= input$mRow1name, mcol1name= input$mcol1name,mcol2name= input$mcol2name,mcol4name= input$mcol4name,mgrptitle= input$mgrptitle))
          }else{
            HTML(fnGenerateKblTbl3columns(df=df,mRow1name= input$mRow1name, mcol1name= input$mcol1name,mcol2name= input$mcol2name,mcol3name= input$mcol3name,mcol4name= input$mcol4name,mgrptitle= input$mgrptitle))

          }
        })

      })


  #########################################
  # Building temporary dataframe called  df
  #########################################
  fnCreateTemporyTbl <- function(mRow1name,mRow2name,mRow3name,mRow4name,mgrptitle,mcol1name,mcol2name,mcol3name){
      Category     <- c(mRow1name,NA,NA,NA,mRow2name,NA,NA,NA,mRow3name,NA,NA,NA,mRow4name,NA,NA,NA)
      Subcategory        <- c("Count",paste("   % within",mRow1name),paste("% within",mgrptitle),"% of Total",
                        "Count",paste("% within",mRow2name),paste("% within",mgrptitle),"% of Total",
                        "Count",paste("% within",mRow3name),paste("% within",mgrptitle),"% of Total",
                        "Count",paste("% within",'Total'),paste("% within",mgrptitle),"% of Total")

      df           <- data.frame(Category,Subcategory)

    df[mcol1name] <- as.character()
    df[mcol2name]   <- as.character()
    df[mcol3name]   <- as.character()
    df['Total']  <- as.character()
    return(df)
  }


  #######################################
  # function to update df
  #######################################

  fnUpdateTemporyTbl <- function(df,mValC11,mValC12,mValC13,mValC21,mValC22,mValC23,mValC31,mValC32,mValC33){
    mTotline16    <- (mValC11 + mValC12 + mValC13)
    mTotline56    <- (mValC21 + mValC22 + mValC23)
    mTotline96    <- (mValC31 + mValC32 + mValC33)
    mTotline133   <- (mValC11 + mValC21  + mValC31)
    mTotline134   <- (mValC12 + mValC22  + mValC32)
    mTotline135   <- (mValC13 + mValC23  + mValC33)
    mTotline136   <- (mTotline133 + mTotline134 + mTotline135)

    df[1,3]      <- mValC11
    df[1,4]      <- mValC12
    df[1,5]      <- mValC13
    df[1,6]      <- mTotline16
    df[5,3]      <- mValC21
    df[5,4]      <- mValC22
    df[5,5]      <- mValC23
    df[5,6]      <- mTotline56
    df[9,3]      <- mValC31
    df[9,4]      <- mValC32
    df[9,5]      <- mValC33
    df[9,6]      <- mTotline96
    df[13,3]      <- mTotline133
    df[13,4]      <- mTotline134
    df[13,5]      <- mTotline135
    df[13,6]      <- mTotline136

    # % of Disease
    df[2,3]      <- fnpercent(mValC11/mTotline16,2)
    df[2,4]      <- fnpercent(mValC12/mTotline16,2)
    df[2,5]      <- fnpercent(mValC13/mTotline16,2)
    df[2,6]      <- fnpercent(mTotline16/mTotline16,2)
    df[6,3]      <- fnpercent(mValC21/mTotline56,2)
    df[6,4]      <- fnpercent(mValC22/mTotline56,2)
    df[6,5]      <- fnpercent(mValC23/mTotline56,2)
    df[6,6]      <- fnpercent(mTotline56/mTotline56,2)
    df[10,3]      <- fnpercent(mValC31/mTotline96,2)
    df[10,4]      <- fnpercent(mValC32/mTotline96,2)
    df[10,5]      <- fnpercent(mValC33/mTotline96,2)
    df[10,6]      <- fnpercent(mTotline96/mTotline96,2)
    df[14,3]     <- fnpercent(mTotline133/mTotline136,2)
    df[14,4]     <- fnpercent(mTotline134/mTotline136,2)
    df[14,5]     <- fnpercent(mTotline135/mTotline136,2)
    df[14,6]     <- fnpercent(mTotline136/mTotline136,2)

    # % of Sex
    df[3,3]      <- fnpercent(mValC11/mTotline133,2)
    df[3,4]      <- fnpercent(mValC12/mTotline134,2)
    df[3,5]      <- fnpercent(mValC13/mTotline135,2)
    df[3,6]      <- fnpercent(mTotline16/mTotline136,2)
    df[7,3]      <- fnpercent(mValC21/mTotline133,2)
    df[7,4]      <- fnpercent(mValC22/mTotline134,2)
    df[7,5]      <- fnpercent(mValC23/mTotline135,2)
    df[7,6]      <- fnpercent(mTotline56/mTotline136,2)
    df[11,3]      <- fnpercent(mValC31/mTotline133,2)
    df[11,4]      <- fnpercent(mValC32/mTotline134,2)
    df[11,5]      <- fnpercent(mValC33/mTotline135,2)
    df[11,6]      <- fnpercent(mTotline96/mTotline136,2)
    df[15,3]     <- fnpercent(mTotline133/mTotline136,2)
    df[15,4]     <- fnpercent(mTotline134/mTotline136,2)
    df[15,5]     <- fnpercent(mTotline135/mTotline136,2)
    df[15,6]     <- fnpercent(mTotline136/mTotline136,2)

    # % of Total
    df[4,3]      <- fnpercent(mValC11/mTotline136,2)
    df[4,4]      <- fnpercent(mValC12/mTotline136,2)
    df[4,5]      <- fnpercent(mValC13/mTotline136,2)
    df[4,6]      <- fnpercent(mTotline16/mTotline136,2)
    df[8,3]      <- fnpercent(mValC21/mTotline136,2)
    df[8,4]      <- fnpercent(mValC22/mTotline136,2)
    df[8,5]      <- fnpercent(mValC23/mTotline136,2)
    df[8,6]      <- fnpercent(mTotline56/mTotline136,2)
    df[12,3]      <- fnpercent(mValC31/mTotline136,2)
    df[12,4]      <- fnpercent(mValC32/mTotline136,2)
    df[12,5]      <- fnpercent(mValC33/mTotline136,2)
    df[12,6]      <- fnpercent(mTotline96/mTotline136,2)
    df[16,3]     <- fnpercent(mTotline133/mTotline136,2)
    df[16,4]     <- fnpercent(mTotline134/mTotline136,2)
    df[16,5]     <- fnpercent(mTotline135/mTotline136,2)
    df[16,6]     <- fnpercent(mTotline136/mTotline136,2)

    df <- sapply(df, as.character)    # Convert all columns to character
    df[is.na(df)] <- ""              # Replace NA with blank
    return(df)
  }


  #####################################################
  # function to generate kbl table
  #####################################################

  our_strwrap <- function(x) lapply(strwrap(x, width = 15, simplify= FALSE), paste, collapse = "\n")

  fnGenerateKblTbl2columns <- function(df,mRow1name,mcol1name,mcol2name,mcol4name,mgrptitle){
    req(input$mgrptitle)
    # Set a Title for the table
    mtitle <- paste(mRow1name," * ",mgrptitle, 'Crosstabulation')
    mtitle <- paste('<h4><STRONG><CENTER>',mtitle, '</CENTER></STRONG><h5>')

    # Set a named vector for dynamic header
    myGrpHeader <- c(" " = 2, mgrptitle = 2, " " = 1)    #where you got this: https://stackoverflow.com/questions/45206908/kableextra-dynamic-add-header-above-labeling
    # set vector names
    names(myGrpHeader) <- c(" ", mgrptitle," ")

    mBorderLineRow <- c(4,8)
    if(substr(input$mTableTypeChk,1,1)=='3'){
      mBorderLineRow <- c(mBorderLineRow,12)
    }
    n <- nrow(df)
    #where you got this https://stackoverflow.com/questions/70871438/creating-horizontal-lines-after-each-collapsed-row-in-kableextra-table
    df %>%
      kbl(align = "llcccc",caption =HTML(mtitle),linesep = "\\addlinespace",row.names=FALSE,
          escape=T, col.names = c("", "", our_strwrap(mcol1name),our_strwrap(mcol2name),our_strwrap(mcol4name))) %>%
      kable_paper(c("striped"),full_width = F) %>%
      column_spec(1, bold = T, background = "#91D1C233",border_left = T) %>%
      column_spec(1,width = "8em", border_right = T) %>%
      column_spec(2,width = "10em", border_right = T) %>%
      column_spec(c(3,4,5), width = "8em") %>%
      column_spec(c(3,4,5), italic = T,border_right = T,width = "8em") %>%
      row_spec(0, bold = T, font_size = 13, extra_css = "border-bottom: 1px solid;") %>%
      row_spec(mBorderLineRow, extra_css = "border-bottom: 1px solid;") %>%
      row_spec(c(n), extra_css = "border-bottom: 1px solid;") %>%
      # kable_styling(bootstrap_options = "striped") %>%
      add_header_above(header = myGrpHeader,
                       bold = T,extra_css ="border-bottom: 1px solid;") %>%
      kable_classic(lightable_options = "basic",
                      html_font = "\"Arial Narrow\", \"Source Sans Pro\", sans-serif")
  }


  fnGenerateKblTbl3columns <- function(df,mRow1name,mcol1name,mcol2name,mcol3name,mcol4name,mgrptitle){
    req(input$mgrptitle)
    # Set a Title for the table
    mtitle <- paste(mRow1name," * ",mgrptitle, 'Crosstabulation')
    mtitle <- paste('<h4><STRONG><CENTER>',mtitle, '</CENTER></STRONG><h5>')

    # Set a named vector for dynamic header
    myGrpHeader <- c(" " = 2, mgrptitle = 3, " " = 1)    #where you got this: https://stackoverflow.com/questions/45206908/kableextra-dynamic-add-header-above-labeling
    # set vector names
    names(myGrpHeader) <- c(" ", mgrptitle," ")

    mBorderLineRow <- c(4,8)
    if(substr(input$mTableTypeChk,1,1)=='3'){
      mBorderLineRow <- c(mBorderLineRow,12)
    }
    n <- nrow(df)
    #where you got this https://stackoverflow.com/questions/70871438/creating-horizontal-lines-after-each-collapsed-row-in-kableextra-table
    df %>%
      kbl(align = "llcccc",caption =HTML(mtitle),linesep = "\\addlinespace",row.names=FALSE,
          escape=T, col.names = c("", "", mcol1name,mcol2name,mcol3name,our_strwrap(mcol4name))) %>%
      kable_paper(c("striped"),full_width = F) %>%
      column_spec(1, bold = T, background = "#91D1C233",border_left = T) %>%
      column_spec(1,width = "8em", border_right = T) %>%
      column_spec(2,width = "10em", border_right = T) %>%
      column_spec(c(3,4,5,6), width = "8em") %>%
      column_spec(c(3,4,5,6), italic = T,border_right = T,width = "8em") %>%
      row_spec(0, bold = T, font_size = 13, extra_css = "border-bottom: 1px solid;") %>%
      row_spec(mBorderLineRow, extra_css = "border-bottom: 1px solid;") %>%
      row_spec(c(n), extra_css = "border-bottom: 1px solid;") %>%
      # kable_styling(bootstrap_options = "striped") %>%
      add_header_above(header = myGrpHeader,
                       bold = T,extra_css ="border-bottom: 1px solid;") %>%
      kable_classic(lightable_options = "basic",
                    html_font = "\"Arial Narrow\", \"Source Sans Pro\", sans-serif")
  }


}

shinyApp(ui, server)