Can you please elaborate? Which area do you want to find?
mn <- 5
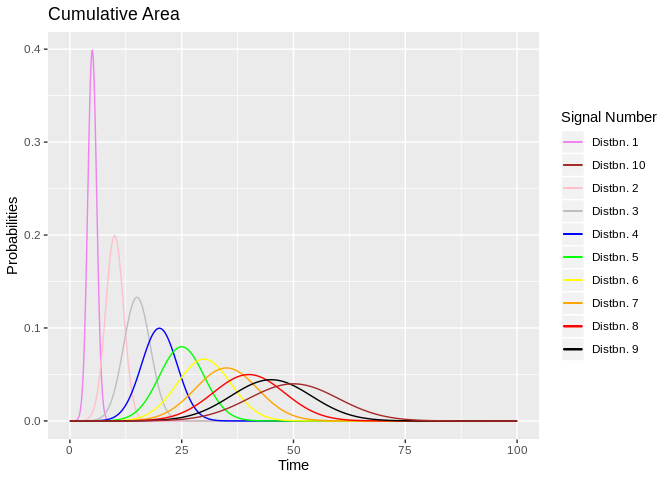
std <- 1.0
up_lmt <- (max(1:10) * 2 * mn)
library(ggplot2)
library(purrr)
ggplot(data = data.frame(u = c(0, up_lmt)),
mapping = aes(x = u)) +
map(.x = 1:10,
.f = ~ stat_function(mapping = aes(colour = paste("Distbn.", .x)),
fun = dnorm,
n = 1e+3,
args = list(mean = (.x * mn),
sd = .x))) +
scale_colour_manual(name = "Signal Number",
values = c("violet", "brown", "pink", "grey", "blue", "green", "yellow", "orange", "red", "black")) +
labs(x = "Time",
y = "Probabilities",
title = "Cumulative Area")
Created on 2019-07-13 by the reprex package (v0.3.0)
If I'm not too wrong, this is the same plot that your code produces. Can you please shade the portion area of which is your objective?
If you want to find the area under the \mathbb{N}(\mu, \sigma^2) density plot from -Inf to x, you use pnorm(x, \mu, \sigma). The area in between a and b, where a < b, is:
pnorm(b, \mu, \sigma) - pnorm(a, \mu, \sigma)
So, the area under the the curve of Signal i to the left of a point t and to the right of 0 will be pnorm(t, (i * mn), i) - pnorm(0, (i * mn), i). Does this help?