Hello everyone!
I used this code:
plot_bar(data, x = "SampleID", fill = "Class")
and I got a nice barplot, but colors are alike and its hard to distinguish Classes .
How can I make each Class (taxon) a different color?
Thanks
Hello everyone!
I used this code:
plot_bar(data, x = "SampleID", fill = "Class")
and I got a nice barplot, but colors are alike and its hard to distinguish Classes .
How can I make each Class (taxon) a different color?
Thanks
HI @alla , is better try to help you if put the reprex.
Try with this
head(dput(data, 100)) #
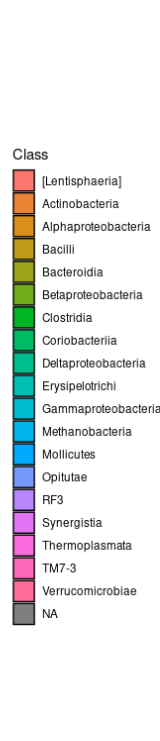
For more control in which color you want, you could addscale_fill_manual()
If you have 20 taxon you need 20 color. Don't forget the color for NA value or omit.
For select better color (RGB) check this page and put the number with # for each color.
library(tidyverse)
ggplot(data,x = "SampleID", fill = "Class") +
  geom_bar()+
  scale_fill_manual(values = c('red', 'blue', 'green','red', 'blue',
                               '#AA9539', '#256F5C', '#AA6339',' #3E3175', '#D6D214',   #You could change manual color
                               'red', 'blue', 'green','red', 'blue',
                               'red', 'blue', 'green','red', 'blue',
                               'red', 'blue', 'green','red', 'blue'))
Oh, I am sorry.
So, data we got is from 16s sequencing.
I did the qiime2 analysis, got all artifacts for further analysis in Rstudio.
Then created a phyloseq object (like herehttps://forum.qiime2.org/t/tutorial-integrating-qiime2-and-r-for-data-visualization-and-analysis-using-qiime2r/4121) , did some cleaning with Decontam package.
So data looks like that:
phyloseq-class experiment-level object
otu_table() OTU Table: [ 1045 taxa and 42 samples ]
sample_data() Sample Data: [ 42 samples by 8 sample variables ]
tax_table() Taxonomy Table: [ 1045 taxa by 7 taxonomic ranks ]
phy_tree() Phylogenetic Tree: [ 1045 tips and 1044 internal nodes ]
Dont worry about this! Is difficult understand well the situation without correct data example.
Check how to put reproducible example, take you time for make this. ![]()
Thank you for your answer!
I try it, but seems I have some issue my phyloseq object is S4 type.
Error in fortify():
! data must be a <data.frame>, or an object coercible by fortify(), not an S4
object with class .
Maybe if you have a phyloseq object like this could help:
This topic was automatically closed 42 days after the last reply. New replies are no longer allowed.
If you have a query related to it or one of the replies, start a new topic and refer back with a link.