ggplot(data, aes(x = Corporations, y = Q1.19, fill = Instruments)) +
geom_bar(position = "stack", stat = "identity") +
coord_polar() +
ggtitle(expression(paste(underline("Quartal 1, 2019")))) +
theme(panel.background = element_rect(colour = "grey"),
panel.border = element_blank(),
panel.grid.major = element_blank(),
panel.grid.minor = element_blank(),
axis.title.x = element_blank(),
axis.title.y = element_blank(),
axis.text.y=element_blank(),
axis.ticks.x = element_blank(),
axis.ticks.y = element_blank(),
plot.title = element_text(hjust = 0.5, size = 20)) +
scale_x_discrete(labels = wrap_format(10)) +
geom_text(aes(y=sum(Q1.19), label = paste(format(sum(Q1.19), big.mark = ".", scientific = FALSE), "€"),),
size = 4, position = position_stack(vjust = 0.7))
Hey Guys,
this is the code I use. I´m not that fit with R so can anybody explain how to change colors in here.
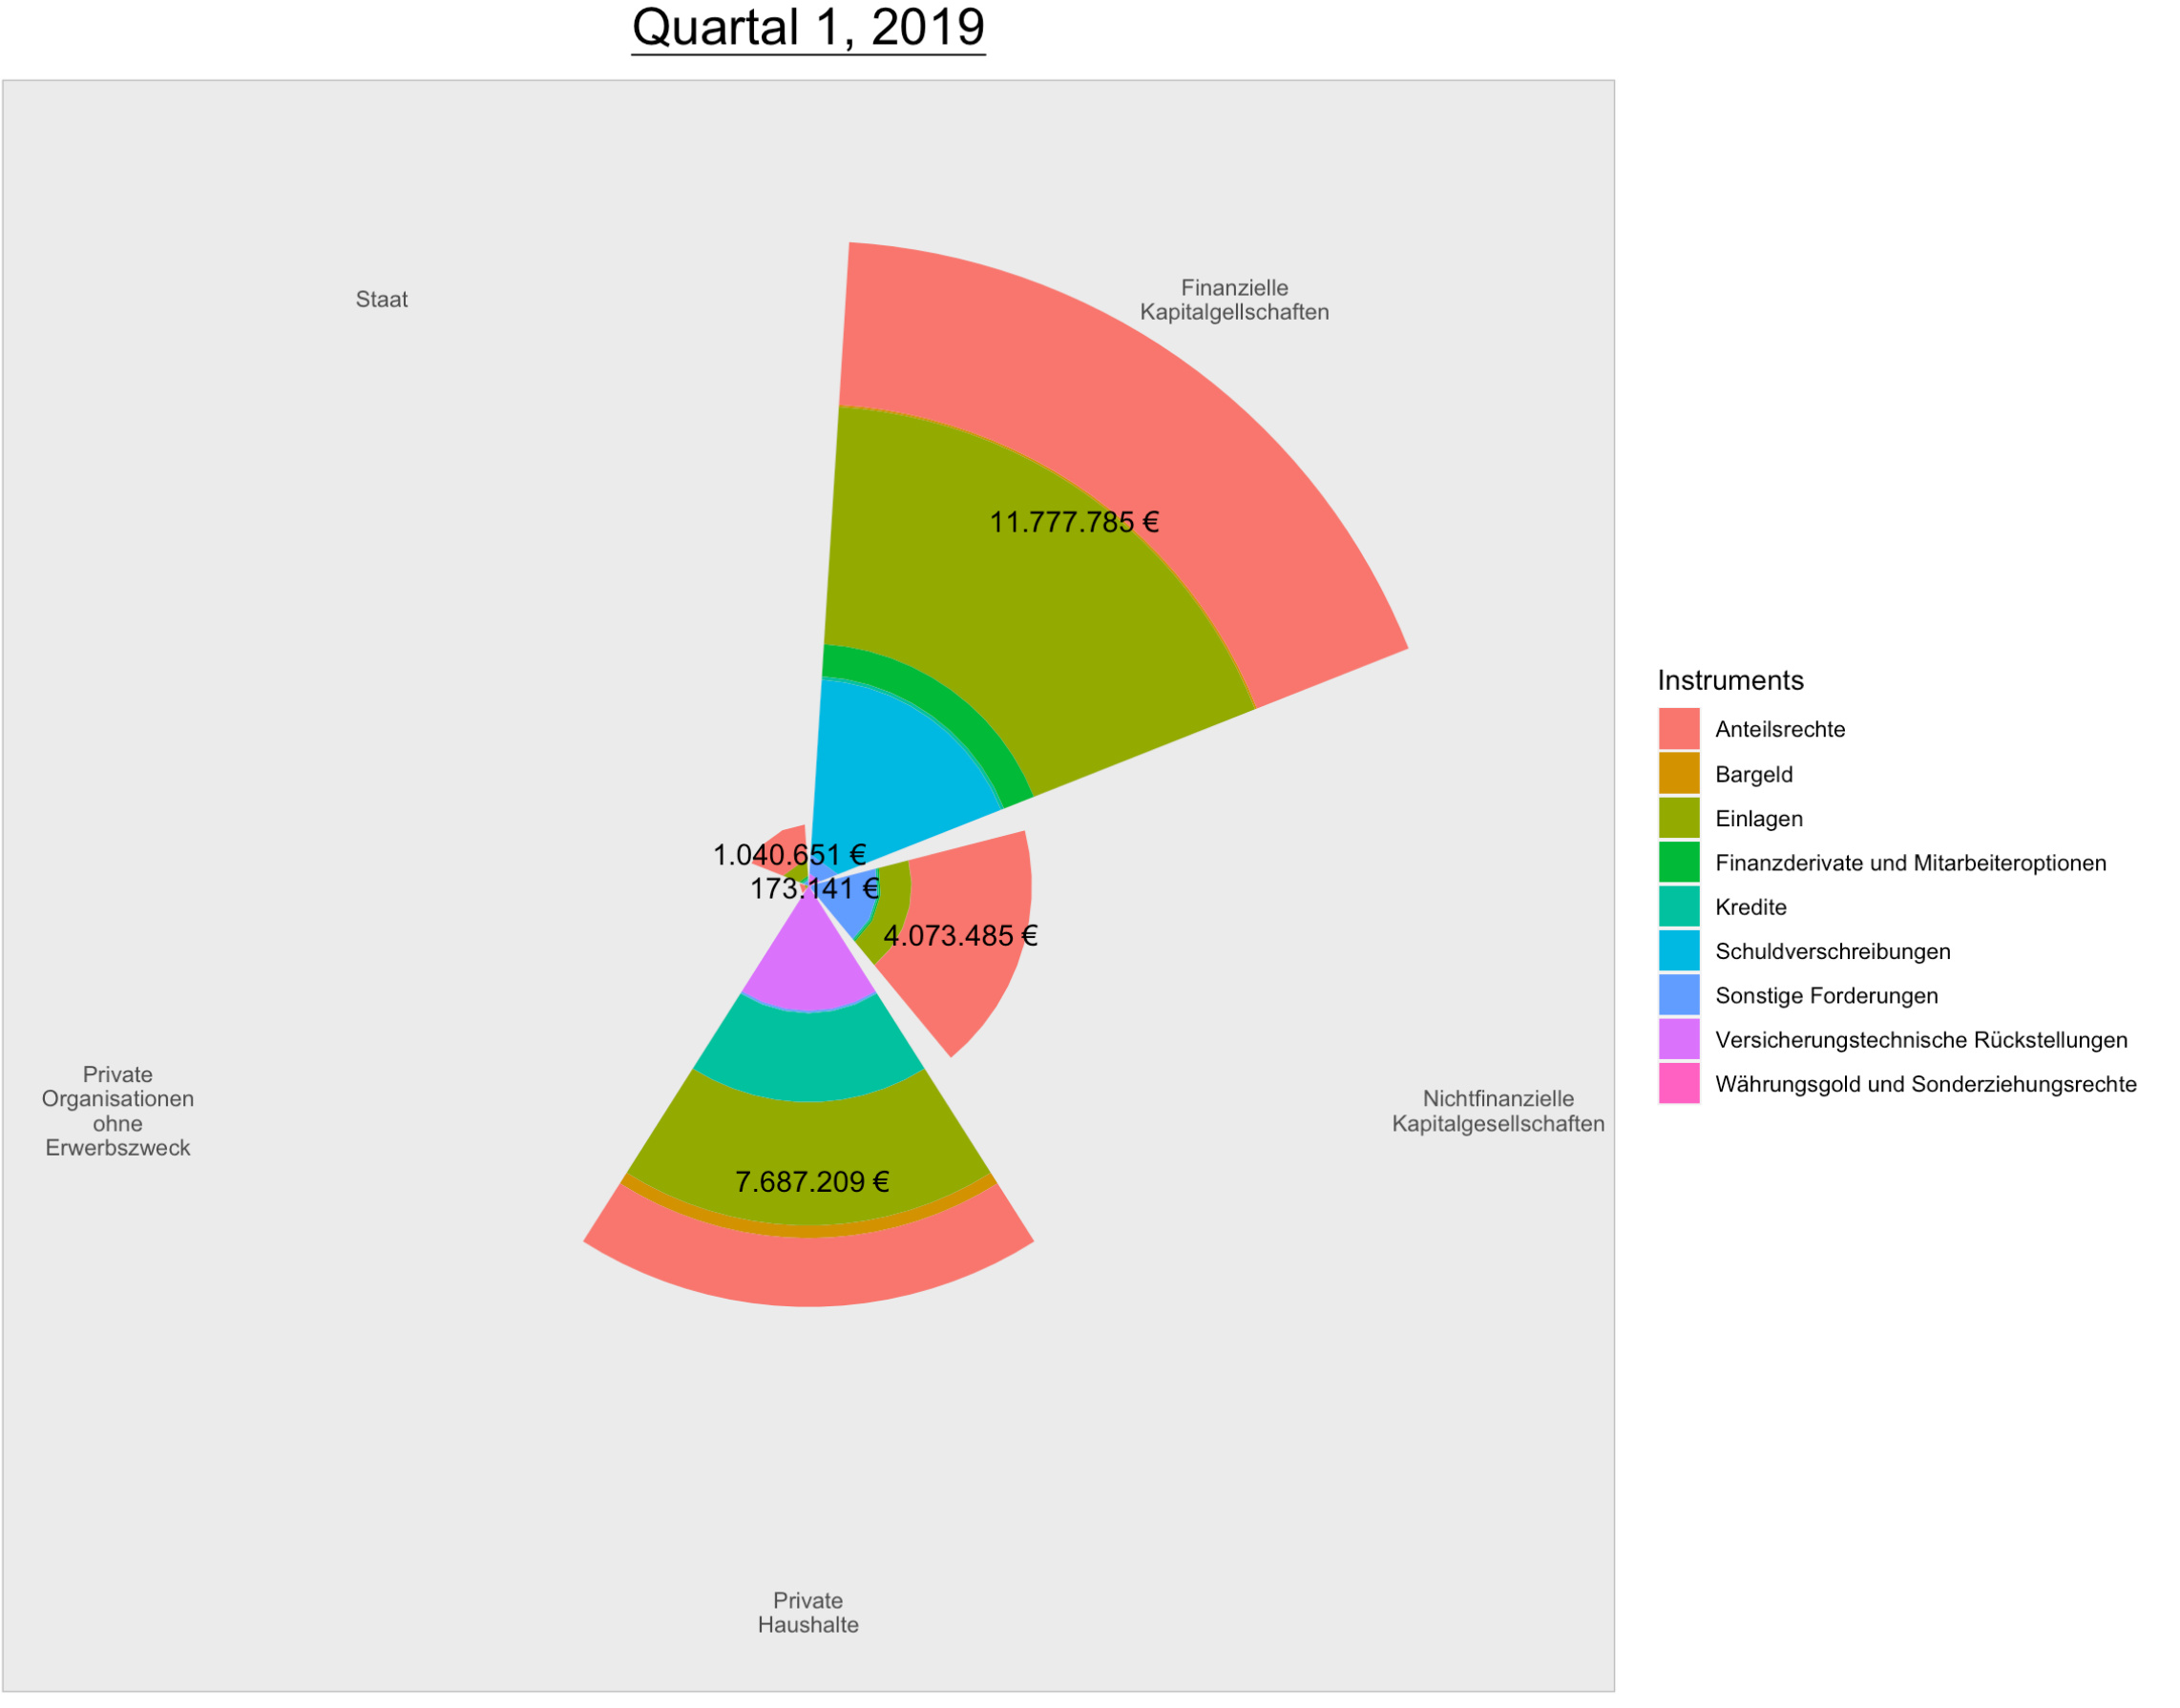
That is the graphic and I want to change all those colors.