One term is n/ [(n+2) (n+1)^2]. The other term is 1/(3n).
n is positive integer, n=1,2,3,....
How to draw a graph to show the first term is always smaller than the second term?
One term is n/ [(n+2) (n+1)^2]. The other term is 1/(3n).
n is positive integer, n=1,2,3,....
How to draw a graph to show the first term is always smaller than the second term?
do square brackets have any special meaning in this notation ?
sorry, I should make it clear. square brackets doesn't have any special meaning. The numerator is n. The denominator is (n+2) (n+1)^2
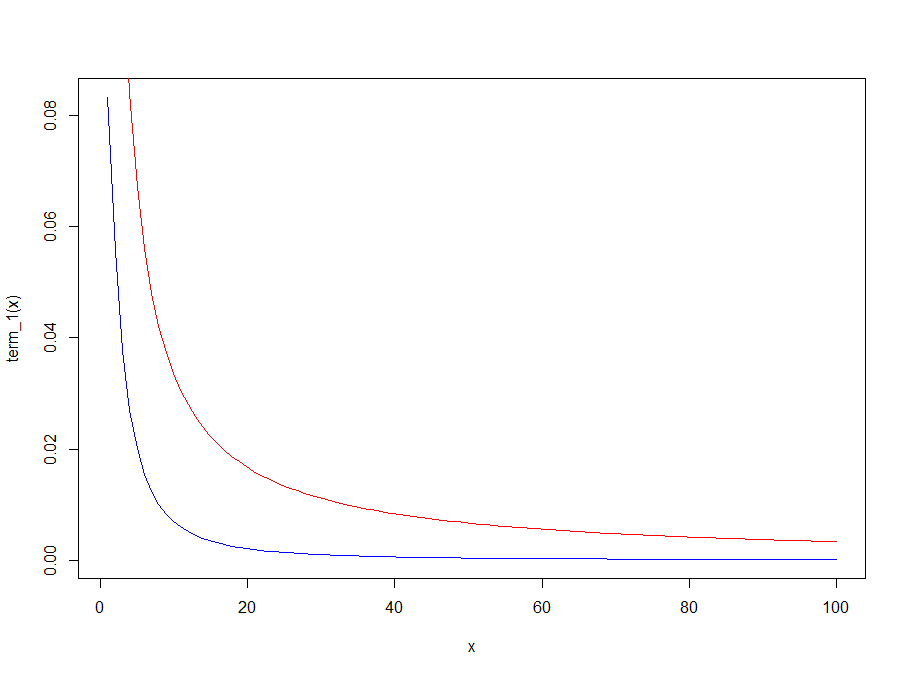
term_1 <- function(n){
  n/((n+2)*(n+1)^2)
}

term_2 <- function(n){
  1/(3*n)
}

curve(term_1,from = 1,to=100,col="blue")
curve(term_2,from = 1,to=100,col="red",add = TRUE)
This topic was automatically closed 7 days after the last reply. New replies are no longer allowed.
If you have a query related to it or one of the replies, start a new topic and refer back with a link.