Hi,
I just have found it, how to do it in R ?
Are there similar packages doing the same thing but in R ?
https://towardsdatascience.com/how-to-find-the-best-theoretical-distribution-for-your-data-a26e5673b4bd
This package fits some common distributions; not sure we can ever find the best:
library(fitdistrplus)
data(groundbeef)
serving <- groundbeef$serving
Comparison of various fits
fitW <- fitdist(serving, "weibull")
fitg <- fitdist(serving, "gamma")
fitln <- fitdist(serving, "lnorm")
summary(fitW)
summary(fitg)
summary(fitln)
1 Like
Hi,
how do I know which distribution is appriopriate for that groundbeef data ?
Good question. This was just a sample dataset. The answer is part knowledge about the dataset (what shape do we expect it to have, how heavy a tail do we expect, etc.), and part how well does a distribution fit the data.
Hi, I have done it and IMHO it turned out to be gamma distribution for this "serving" data:
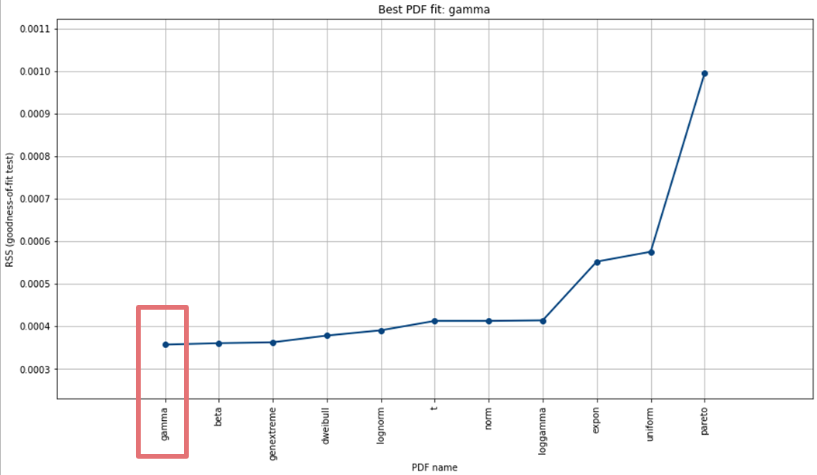
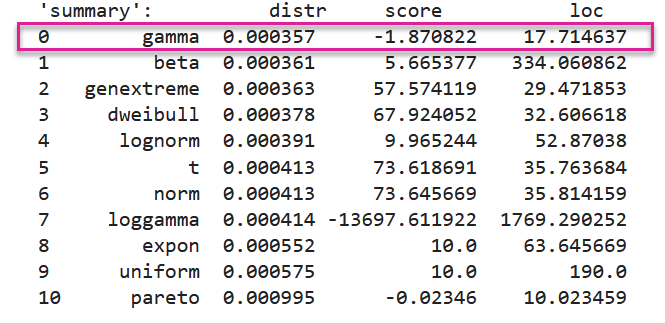
Could you please check it @fcas80 ? Is it correct ?
I don't think there's a perfect answer, and a lot depends on what physical constraints you must apply (e.g., values must be positive). One of many approaches is to generate the Cullen and Fry, which shows the kurtosis against the square of the skewness. Something like:
fitdistrplus::descdist(mydataframe, discrete=FALSE, boot=500)
It's not perfect, but sometimes helps.
Stephen
Thank you for your reply, I have done it as you suggested:
fitdistrplus::descdist(groundbeef$serving, discrete=FALSE, boot=500)
and received this:

How to interpret that ?
If you were to follow the diagram strictly, it suggests the data follows a Beta distribution. Is that likely? If the data is bounded above and below, then that might be true. Alternatively, you may notice that the data is quite close to the line corresponding to the Gamma distribution. If the data is bounded below but not above, and if the variability scales with the mean, that might be a good choice. So, there is no "correct" choice - it depends on the problem knowledge you have. The diagram helps, but it is only a guide.
You can also see that there is quite a fine distinction between the Gamma and the log-Normal when the skewness is not too large. These two distributions can be hard to separate, particularly if the number of points is small.
Having said all this, I would probably have chosen a Gamma. In part, this is because it is one of the exponential family and a lot of extended models (GLM, GLMM, etc) support this model. In this case, I can't see compelling evidence to choose otherwise... That's not perfect logic, but it is a good starting point. But, I really think it's important to check problem knowledge here.
Good luck
Stephen
2 Likes
Hi, thank you for your kind explanation.
How do you know if I may ask, is it beacuse grey rectangle in the legend reflects all the grey area in the plot ?
kind regards,
Andrzej
Yes, the gray rectangle area suggests the Beta distribution. But, again, it is only a guide... Problem knowledge is just as important as the data.
This topic was automatically closed 42 days after the last reply. New replies are no longer allowed.
If you have a query related to it or one of the replies, start a new topic and refer back with a link.