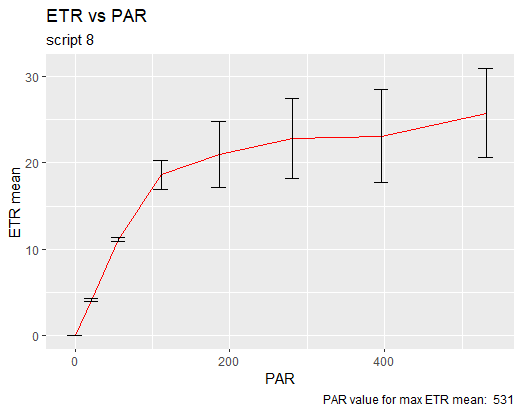
I have graphed a dataframe and got this asymptote. How can I go about finding the point where the curve starts to plateau? That is, the minimum slope, I think.
I think it would be something along these lines
library(tidyverse)
example_data <- structure(list(x = c(1:40), y = c(
0.165, 2.572,
4.365, 5.576, 6.456, 7.173, 7.811, 8.399, 8.811, 8.631, 7.761,
7.443, 7.619, 7.89, 8.12, 8.321, 8.535, 8.773, 8.858, 8.248,
6.821, 6.163, 6.172, 6.321, 6.433, 6.52, 6.631, 6.779, 6.761,
5.967, 4.264, 3.442, 3.383, 3.489, 3.556, 3.588, 3.613, 3.638,
3.663, 3.689
)), class = "data.frame", row.names = c(NA, -40L))%>% slice(1:20)
model <- smooth.spline(x = example_data$x, y = example_data$y)
more_x <- seq(from=1,to=20,length=8000)
Y <- predict(model, x = more_x, deriv = 1) # first derivative
Yo <- predict(model, x = more_x, deriv = 0) # original
(deriv_data <- tibble(data.frame(Y)) %>%
mutate(abs_y=abs(y)))
(smooth_data <- tibble(data.frame(Yo)))
(x_of_min_deriv <- deriv_data$x[which.min(deriv_data$abs_y)])
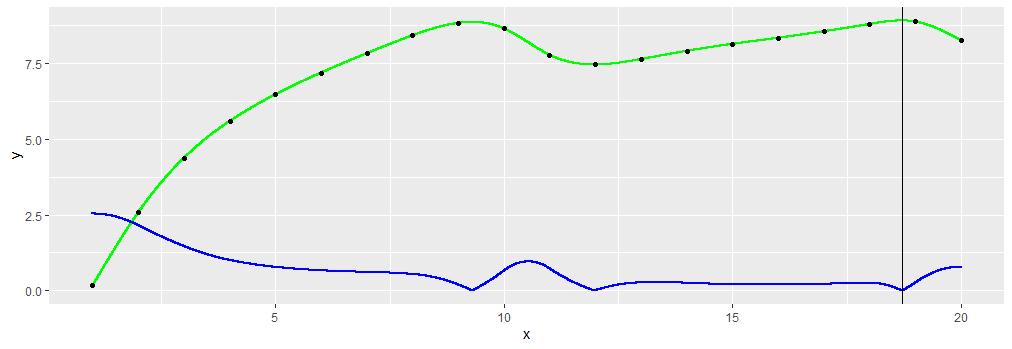
ggplot() +
geom_point(data=smooth_data,
aes(x,y),color="green",size=.1) +
geom_point(data=example_data,
aes(x,y)) +
geom_point(data=deriv_data,
aes(x,abs_y),color="blue",size=.1) +
geom_vline(xintercept = x_of_min_deriv)
Edited to also show the initial smooth.spline in green
1 Like
That is exactly how I would do it. Smoothing splines is a great way to estimate the derivative of data.
While nirgrahamuk absolutely answered the question in the title (assuming degrees of splines are not of concern), I feel OP is mainly interested in finding the "elbow" (or knee) point, and I'm not convinced that it corresponds to minimum slope of curve.
I do agree that finding the 'knee of the curve' is a different question to the one I chose to answer.
I found this material : (PDF) Reliable computations of knee point for a curve and introduction of a unit invariant estimation (researchgate.net)
It includes R code in the appendix !
I thought the minimum slope was the same point that the knee of the curve, my fault.
Thank you so much for your answers, the code and the material!
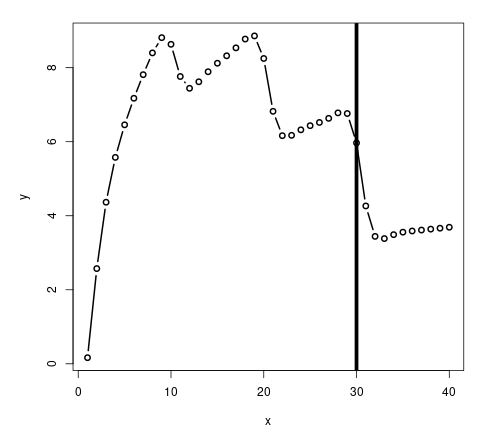
Here is my attempt at a knee. This is based on https://www.datasciencecentral.com/how-to-automatically-determine-the-number-of-clusters-in-your-dat/ , except I am allowing positive or negative strength.
library(dplyr)
x <- seq(from=1, to=40)
y = c(
0.165, 2.572,
4.365, 5.576, 6.456, 7.173, 7.811, 8.399, 8.811, 8.631, 7.761,
7.443, 7.619, 7.89, 8.12, 8.321, 8.535, 8.773, 8.858, 8.248,
6.821, 6.163, 6.172, 6.321, 6.433, 6.52, 6.631, 6.779, 6.761,
5.967, 4.264, 3.442, 3.383, 3.489, 3.556, 3.588, 3.613, 3.638,
3.663, 3.689)
df <- data.frame(cbind(x,y))
df$delta1 <- lag(df$y) - df$y
df$delta2 <- round(lag(df$delta1) - df$delta1,2)
df$strength <- ifelse(!is.na(lead(df$delta2) - lead(df$delta1)) , lead(df$delta2) - lead(df$delta1), NA)
head(df,10)
m <- max(abs(df$strength), na.rm=TRUE)
m
w <- which(df$strength == m | df$strength == -m)
w
plot(x,y,"b", col="black", lwd=2)
abline(v=w, col="black", lwd=5)
x y delta1 delta2 strength
1 1 0.165 NA NA NA
2 2 2.572 -2.407 NA 1.183
3 3 4.365 -1.793 -0.61 0.631
4 4 5.576 -1.211 -0.58 0.550
5 5 6.456 -0.880 -0.33 0.557
6 6 7.173 -0.717 -0.16 0.558
7 7 7.811 -0.638 -0.08 0.538
8 8 8.399 -0.588 -0.05 0.232
9 9 8.811 -0.412 -0.18 -0.770
10 10 8.631 0.180 -0.59 -1.560
[1] 2.613
[1] 30
Thank you so much, this is very helpful for me.
This topic was automatically closed 21 days after the last reply. New replies are no longer allowed.
If you have a query related to it or one of the replies, start a new topic and refer back with a link.