How to fit multiple probability density function in one graph

Hi, I meet another problem when i learning R.
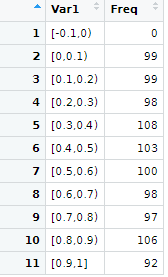
(1)A set of data, divided them and counting the number of individuals each range.
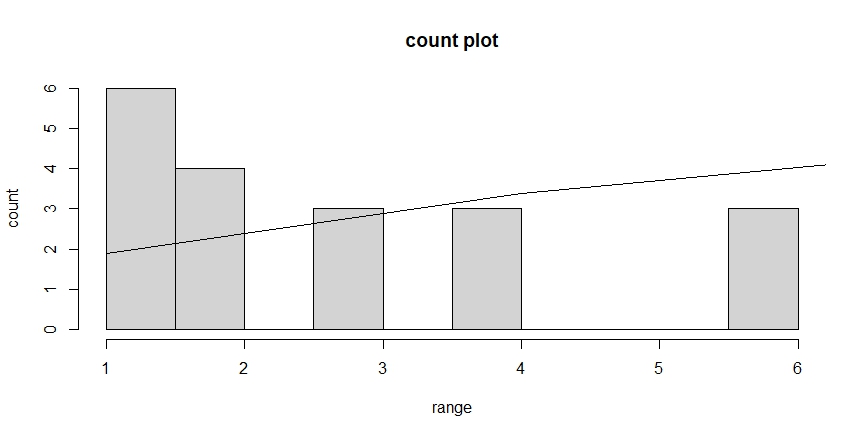
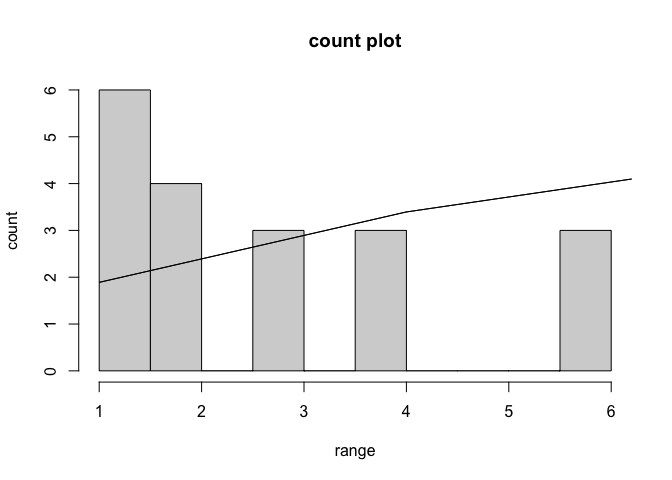
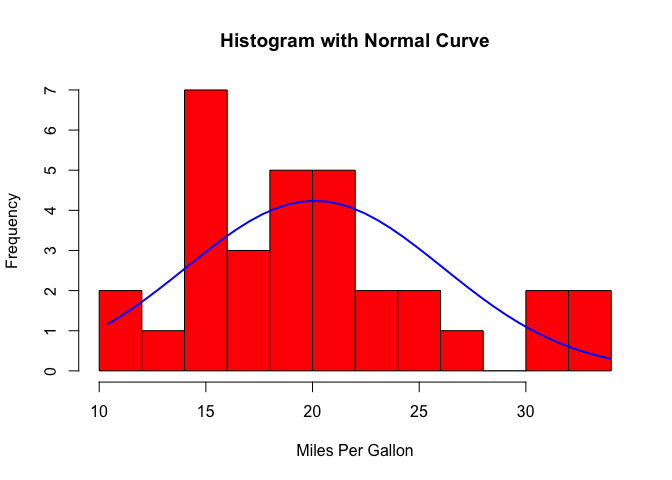
(2)Plot a histogram to show (1), the vertical coordinate is the number.
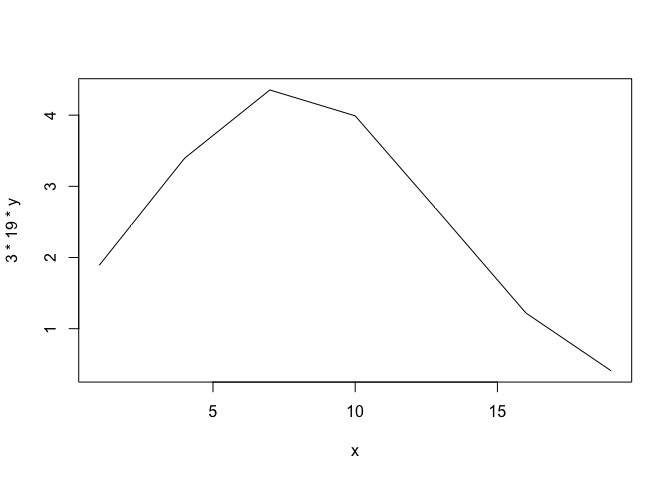
(3)Then get the predict value of the number each range by using different probability density functions.
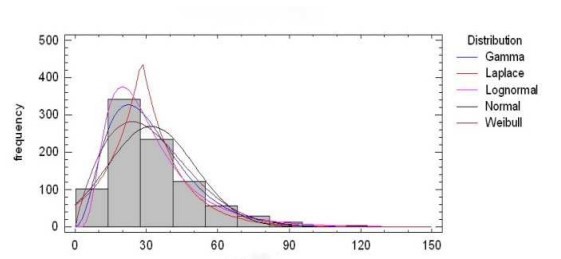
(4)Then get many lines of predicting number. Plot them in one graph.
There seems to be a problem with the graph I drew, there are gaps in the middle and the horizontal coordinates are not in the centre of the bars. Do I get the predict values in the correct way? And how to draw different probability density function curves in one graph to show the predict number respectively?

In a word, show the data distribution and the corresponding distribution functions.

Thank you for your effort and help on this problem in advance.

a1 <- c(16.6,1.0,10.1,8.6,8.0,17.0,2.4,7.6,5.7,11.6,3.6,2.8,6.3,1.5,2.7,16.7,6.7,5.3,12.5)
bins <- seq(min(a1), max(a1) + 3, by = 3)
a1_bin <- cut(a1, bins, right = FALSE, labels = FALSE)
hist(a1_bin, breaks = length(bins)+1, main = "count plot", xlab = "range", ylab = "count")
M<-mean(a1)
s<-sd(a1)
x<-bins
y<-dnorm(bins,M,s)
lines(x,3*19*y)

The 3 is the interval, 19 is the length of a1.
Created on 2023-03-25 with reprex v2.0.2

This appears more of a what problem than a why problem. Axes seem incommensurate.

a1 <- c(16.6,1.0,10.1,8.6,8.0,17.0,2.4,7.6,5.7,11.6,3.6,2.8,6.3,1.5,2.7,16.7,6.7,5.3,12.5)
bins <- seq(min(a1), max(a1) + 3, by = 3)
a1_bin <- cut(a1, bins, right = FALSE, labels = FALSE)
hist(a1_bin, breaks = length(bins)+1, main = "count plot", xlab = "range", ylab = "count")
M<-mean(a1)
s<-sd(a1)
x<-bins
y<-dnorm(bins,M,s)
lines(x,3*19*y)
lines(x, 3 * 19 * y)

plot(x, 3 * 19 * y, type = "l")

Created on 2023-03-25 with reprex v2.0.2

1 Like

@technocrat Thank you for your help and effort on my question. I am sorry it may make you confused for my english is not very good . Actually, I want to get the result seems like the belowing picture shows. Of course, the interval, the max, the min, and frequency may be different. And you could also generate simulated random numbers using R to show your understanding.
Many thanks for your kind and warm help.
拟合示例

1 Like

English is a world language spoken probably by more people who learned it not as a first language, and yours is certainly more fluent than any of my acquired languages. Posing questions clearly is hard in any language, but the graph illustrates it brilliantly.

Here's a start

# https://rpubs.com/Felix/7795
x <- mtcars$mpg
h <- hist(x, breaks = 10, col = "red", xlab = "Miles Per Gallon", main = "Histogram with Normal Curve")
xfit <- seq(min(x), max(x), length = 40)
yfit <- dnorm(xfit, mean = mean(x), sd = sd(x))
yfit <- yfit * diff(h$mids[1:2]) * length(x)
lines(xfit, yfit, col = "blue", lwd = 2)


set.seed(42)   
d <- rgamma(100, shape = 1, rate = 1)
p <- MASS::fitdistr(d, "gamma")
x <- seq(min(d), max(d), length.out = 100)
hist(d, breaks = 30, freq = FALSE, col = "grey", ylim = c(0, 1))
curve(dgamma(x, shape = p$estimate[1], rate = p$estimate[2]), add = TRUE)
lines(sort(d), dgamma(sort(d), shape = 1),
      col = "green", lty = "dotted")

1 Like

Thank you for your effort and time on this question. The problem has almost been solved. I will try again based on your suggestion.

1 Like

@technocrat Sorry to disturb you again. I make it by lines() based on your help. I have another problem. Would you mind give me some advice and help about it? As you could see, I get a dataframe "data2", one column is different interval, another is the number of individual in each interval. How colud i get the result like original post question? And the Horizontal coordinates(X-coordinates) are different intervals(dat2$Var1).
Thank you for your help in advance.

set.seed(123)
dat1<-data.frame(runif(1000))
c1<-dat1
c2<-1:1000
c3<-data.frame(c2,c1)
colnames(c3)<-c("id","col")
bins<-seq(-0.1,1,0.1)
c3$groups <- cut(c3$col,breaks=bins,include.lowest=TRUE,right = FALSE)
View(c3)
counts<-table(c3$groups)
c3$counts <- counts[match(c3$groups,names(counts))]
counts
dat2<-data.frame(counts)

image

Created on 2023-04-06 with reprex v2.0.2

Sorry to have missed this earlier. Could you start a new thread to pose the question with the reprex in one message?

@technocrat Never mind. Here is the new post. Thank for your help.

This topic was automatically closed 7 days after the last reply. New replies are no longer allowed.

If you have a query related to it or one of the replies, start a new topic and refer back with a link.