How to get a histogram

Hy!

I 'm having problems to get two histograms from a dataframe(df):

  1. The first one is about getting one histograma from a column "number_of_reviews" (int) relatet about the result of another column "host_is_superhost " (chr) .

  2. The second one is about getting one histogram involving 3 columns: for each value of column “CATEGORÍA” (chr) , showing the amount of the column "security deposit" (int) based on whether the column "host is a super host" (chr) or not.

For the first one have I tryed:
ggplot(df)+geom_histogram(mapping=aes(x=host_identity_verified, fill=number_of_reviews))

Thank you :slight_smile:

Hello,

you can ask questions about homework assignments, but have a look at this page to see, what would improve your question.

To get meaningful answers, it is always a good idea to post some data (which can be done with dput(MYDATA) or, if you want to share just a tiny bit, dput(head(MYDATA, 50))). You should also share the code you tried so far, just to get an idea where your problem occurs (e.g. are you using base R oder ggplot2 to create your histogram?).

Consider editing your answer or post further informations in the comments.

Kind regards

Hy!

I am new at hear, so I am sorry if I did not explain my self.

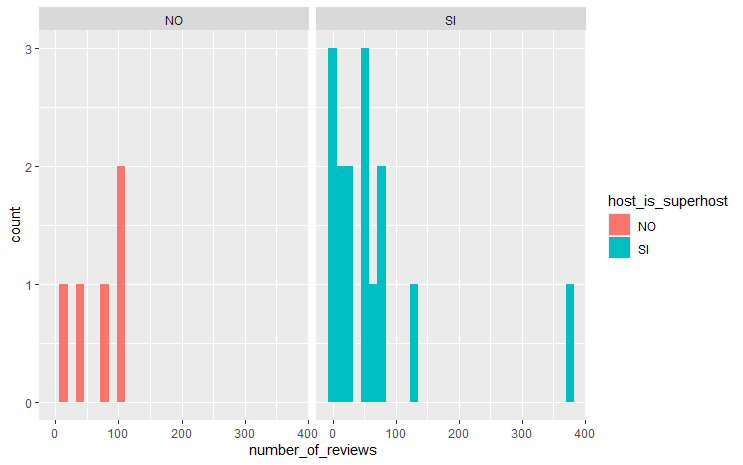
I have tryed for the first histogram:

ggplot(df)+geom_histogram(mapping=aes(x=host_identity_verified, fill=number_of_reviews))

dput(df[ 1:20, ] )

structure(list(host_is_superhost = c("SI", "SI", "SI", "SI", 
"NO", "SI", "NO", "SI", "SI", "SI", "SI", "SI", "SI", "SI", "SI", 
"SI", "SI", "NO", "NO", "NO"), host_identity_verified = c("NO VERIFICA", 
"VERIFICA", "NO VERIFICA", "VERIFICA", "VERIFICA", "NO VERIFICA", 
"VERIFICA", "VERIFICA", "NO VERIFICA", "VERIFICA", "VERIFICA", 
"VERIFICA", "VERIFICA", "VERIFICA", "VERIFICA", "VERIFICA", "NO VERIFICA", 
"VERIFICA", "VERIFICA", "VERIFICA"), bathrooms = c(3L, 3L, 3L, 
3L, 3L, 3L, 5L, 3L, 3L, 3L, 3L, 3L, 5L, 17L, 5L, 3L, 3L, 3L, 
3L, 3L), bedrooms = c(1L, 1L, 1L, 1L, 0L, 1L, 1L, 1L, 1L, 1L, 
1L, 1L, 2L, 1L, 2L, 1L, 1L, 1L, 1L, 1L), daily_price = c(94L, 
125L, 100L, 120L, 70L, 200L, 700L, 250L, 100L, 280L, 320L, 240L, 
290L, 290L, 220L, 84L, 60L, 99L, 110L, 110L), security_deposit = c(1L, 
31L, 1L, 48L, 13L, 48L, 1L, 73L, 13L, 1L, 1L, 1L, 1L, 1L, 1L, 
38L, 1L, 56L, 1L, 1L), minimum_nights = c(2L, 2L, 2L, 2L, 30L, 
15L, 1L, 1L, 1L, 1L, 1L, 1L, 1L, 1L, 1L, 2L, 30L, 3L, 2L, 2L), 
    number_of_reviews = c(84L, 3L, 70L, 57L, 44L, 79L, 72L, 126L, 
    377L, 22L, 31L, 1L, 3L, 48L, 10L, 56L, 7L, 7L, 103L, 107L
    ), review_scores_rating = c(94L, 100L, 97L, 97L, 90L, 98L, 
    96L, 98L, 94L, 95L, 95L, 40L, 60L, 94L, 86L, 91L, 100L, 94L, 
    95L, 94L), CATEGORIA = c("TOP", "TOP", "TOP", "TOP", "TOP", 
    "TOP", "TOP", "TOP", "TOP", "TOP", "TOP", "NO ACONSEJABLE", 
    "ESTANDAR", "TOP", "TOP", "TOP", "TOP", "TOP", "TOP", "TOP"
    )), row.names = c(NA, 20L), class = "data.frame")

you could paste the results of this:

dput(df[ 1:20, ] ) # for first 20 rows. 

thank you, here it is:

dput(df[ 1:20, ] )

structure(list(host_is_superhost = c("SI", "SI", "SI", "SI", 
"NO", "SI", "NO", "SI", "SI", "SI", "SI", "SI", "SI", "SI", "SI", 
"SI", "SI", "NO", "NO", "NO"), host_identity_verified = c("NO VERIFICA", 
"VERIFICA", "NO VERIFICA", "VERIFICA", "VERIFICA", "NO VERIFICA", 
"VERIFICA", "VERIFICA", "NO VERIFICA", "VERIFICA", "VERIFICA", 
"VERIFICA", "VERIFICA", "VERIFICA", "VERIFICA", "VERIFICA", "NO VERIFICA", 
"VERIFICA", "VERIFICA", "VERIFICA"), bathrooms = c(3L, 3L, 3L, 
3L, 3L, 3L, 5L, 3L, 3L, 3L, 3L, 3L, 5L, 17L, 5L, 3L, 3L, 3L, 
3L, 3L), bedrooms = c(1L, 1L, 1L, 1L, 0L, 1L, 1L, 1L, 1L, 1L, 
1L, 1L, 2L, 1L, 2L, 1L, 1L, 1L, 1L, 1L), daily_price = c(94L, 
125L, 100L, 120L, 70L, 200L, 700L, 250L, 100L, 280L, 320L, 240L, 
290L, 290L, 220L, 84L, 60L, 99L, 110L, 110L), security_deposit = c(1L, 
31L, 1L, 48L, 13L, 48L, 1L, 73L, 13L, 1L, 1L, 1L, 1L, 1L, 1L, 
38L, 1L, 56L, 1L, 1L), minimum_nights = c(2L, 2L, 2L, 2L, 30L, 
15L, 1L, 1L, 1L, 1L, 1L, 1L, 1L, 1L, 1L, 2L, 30L, 3L, 2L, 2L), 
    number_of_reviews = c(84L, 3L, 70L, 57L, 44L, 79L, 72L, 126L, 
    377L, 22L, 31L, 1L, 3L, 48L, 10L, 56L, 7L, 7L, 103L, 107L
    ), review_scores_rating = c(94L, 100L, 97L, 97L, 90L, 98L, 
    96L, 98L, 94L, 95L, 95L, 40L, 60L, 94L, 86L, 91L, 100L, 94L, 
    95L, 94L), CATEGORIA = c("TOP", "TOP", "TOP", "TOP", "TOP", 
    "TOP", "TOP", "TOP", "TOP", "TOP", "TOP", "NO ACONSEJABLE", 
    "ESTANDAR", "TOP", "TOP", "TOP", "TOP", "TOP", "TOP", "TOP"
    )), row.names = c(NA, 20L), class = "data.frame")

Hey,

I think before we give any detailed solution, I will give you a hint to get close to the result (I think) is demanded. There is a function called ggplot2::facet_wrap(). It can take categorical variables and split one histogram containing values from all groups into a histogram for every group. You should read the documentation and try it yourself. And as a friendly reminder: a histogram is about continous x variables (which is what the error you got from your code above says you). So try to think about the scales your variables have, either they are categorical (ordered or unorded \Rightarrow discrete) and which one are indeed continous and can be used inside a histogram (which is not the same as a bar chart which would be appropriate for discrete variables).

As another advice, don't use fill inside the ggplot2::geom_histogram() call. I mean sure, it will work, but the result will stack the values up another and it will look ugly. Here is what I mean demonstrated:

library(ggplot2)

mtcars |>
  ggplot() +
  geom_histogram(aes(x = mpg, fill = as.factor(cyl)))
#> `stat_bin()` using `bins = 30`. Pick better value with `binwidth`.


mtcars |>
  ggplot() +
  geom_histogram(aes(mpg)) +
  facet_wrap(~ cyl)
#> `stat_bin()` using `bins = 30`. Pick better value with `binwidth`.

Created on 2022-11-02 by the reprex package (v2.0.1)

Kind regards

first plot maybe is this:

ggplot(df,aes(x=number_of_reviews, fill=host_is_superhost)) +
  geom_histogram(bins = 30) + facet_wrap(~host_is_superhost)  # Add facet for better see the variables

For second maybe not is god ides histogram, because you have many variables.

ggplot(df,aes(x=CATEGORIA,  y=security_deposit,fill=host_is_superhost )) +
  geom_col() + facet_wrap(~host_is_superhost)

This topic was automatically closed 7 days after the last reply. New replies are no longer allowed.

If you have a query related to it or one of the replies, start a new topic and refer back with a link.