jennyv0
November 21, 2022, 4:44pm
1
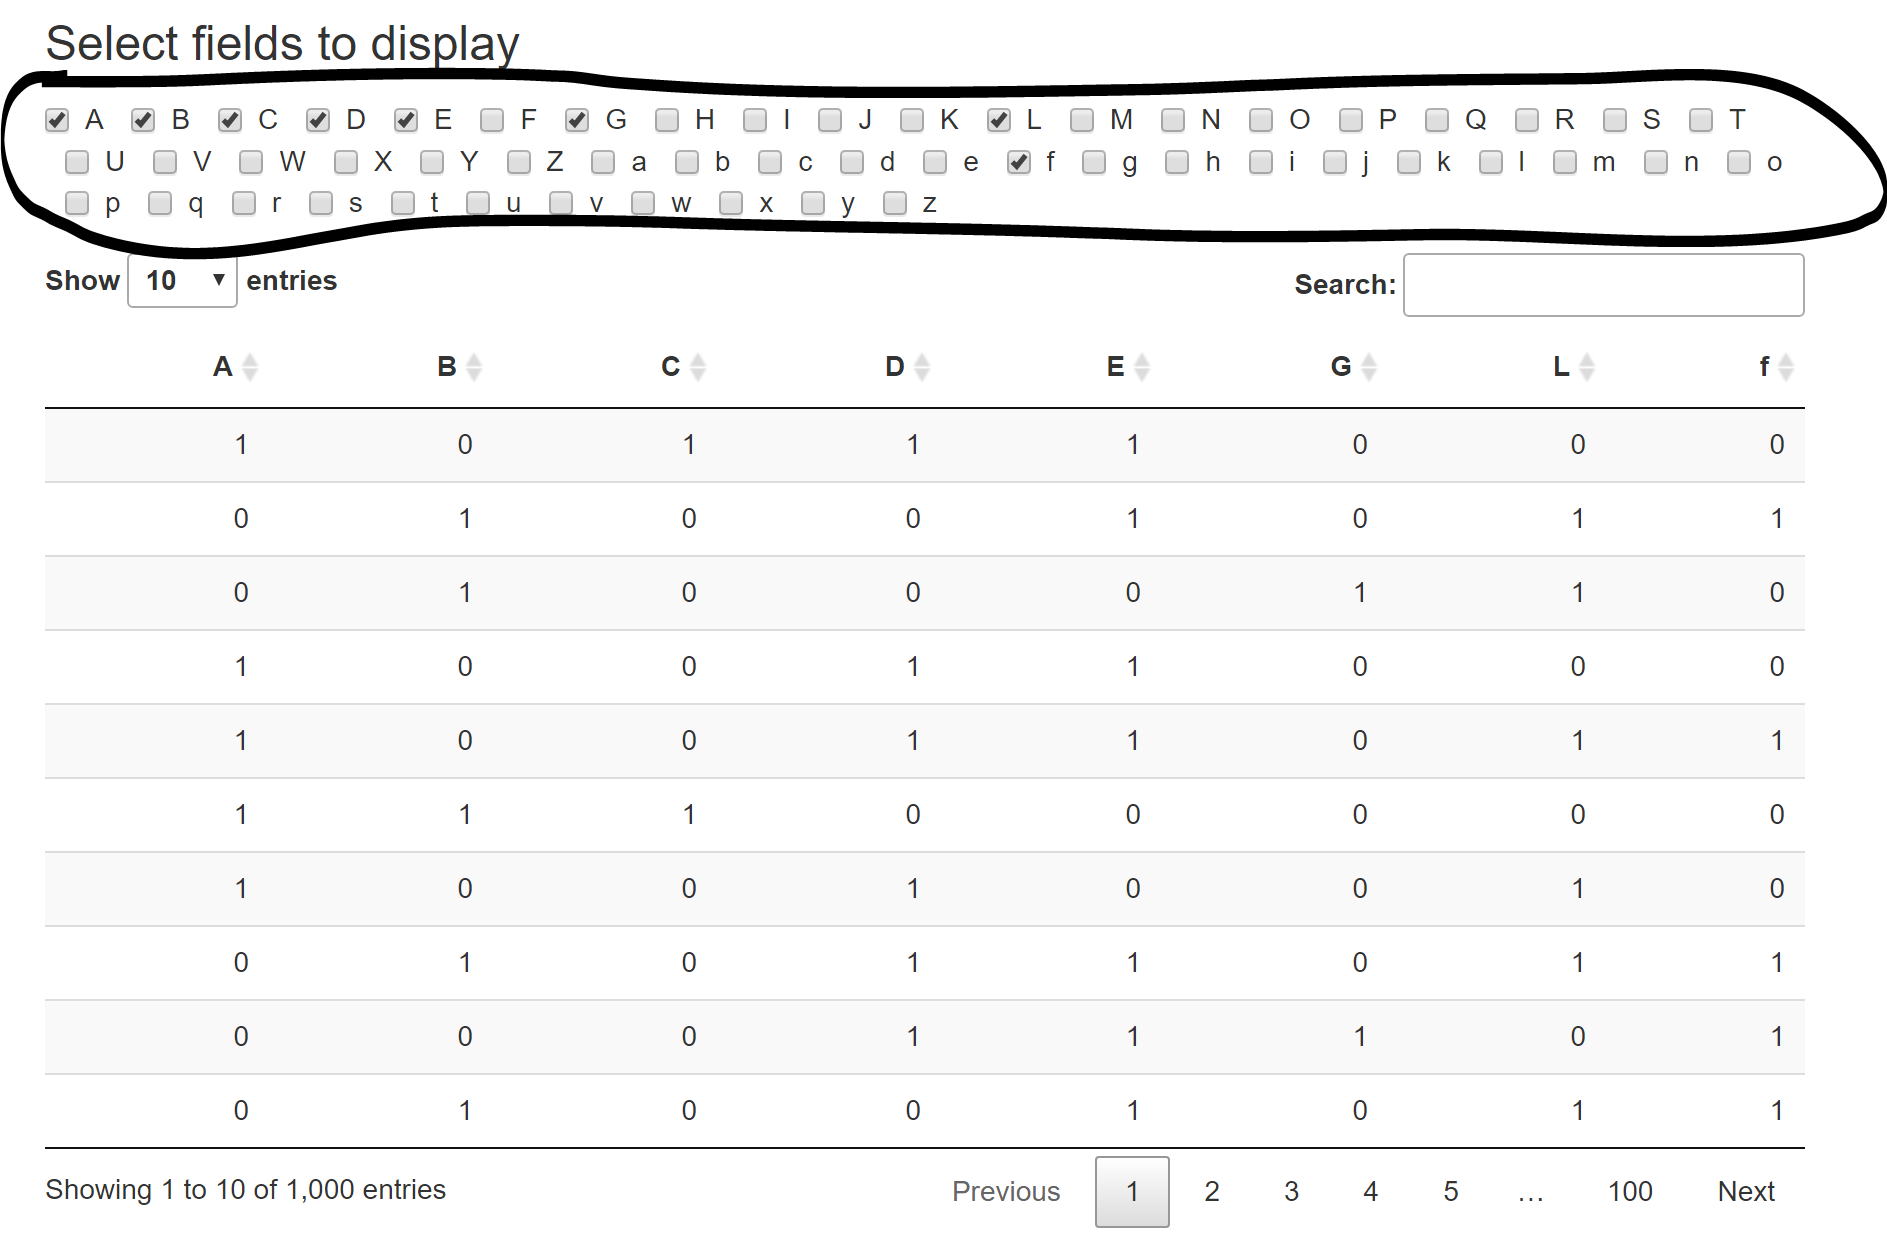
I am creating a shiny app that contains a DT data table that allows the user to select the columns to be displayed as there are many fields.
At the moment, the checkbox area is looking like this:
but I would like for it to look more neat and orderly, and arranged in two subgroups: "Upper case" and "Lower case" across multiple columns.
How do I go about doing this?
My code:
library(shiny)
library(DT)

# Create data frame
column_names <- c(toupper(letters[1:26]),tolower(letters[1:26]))
df <- data.frame(replicate(length(column_names),sample(0:1,1000,rep=TRUE)))

# assign column names
colnames(df) = column_names


ui <- fluidPage(
  checkboxGroupInput(
    "column_selection",
    h3("Select fields to display"),
    choices = column_names,
    inline = TRUE,
    selected = c('A','B','C')
  ),
  DT::dataTableOutput("alphabet")
)


# Define server logic required to draw a histogram
server <- function(input, output) {

  output$alphabet <- DT::renderDT({
    columns = column_names
    if (!is.null(input$column_selection)) {
      columns = input$column_selection
    }
    datatable(
      df[, columns, drop = FALSE],
      class = "row-border hover stripe",
      rownames = FALSE
    )
  })
}

# Run the application
shinyApp(ui = ui, server = server)
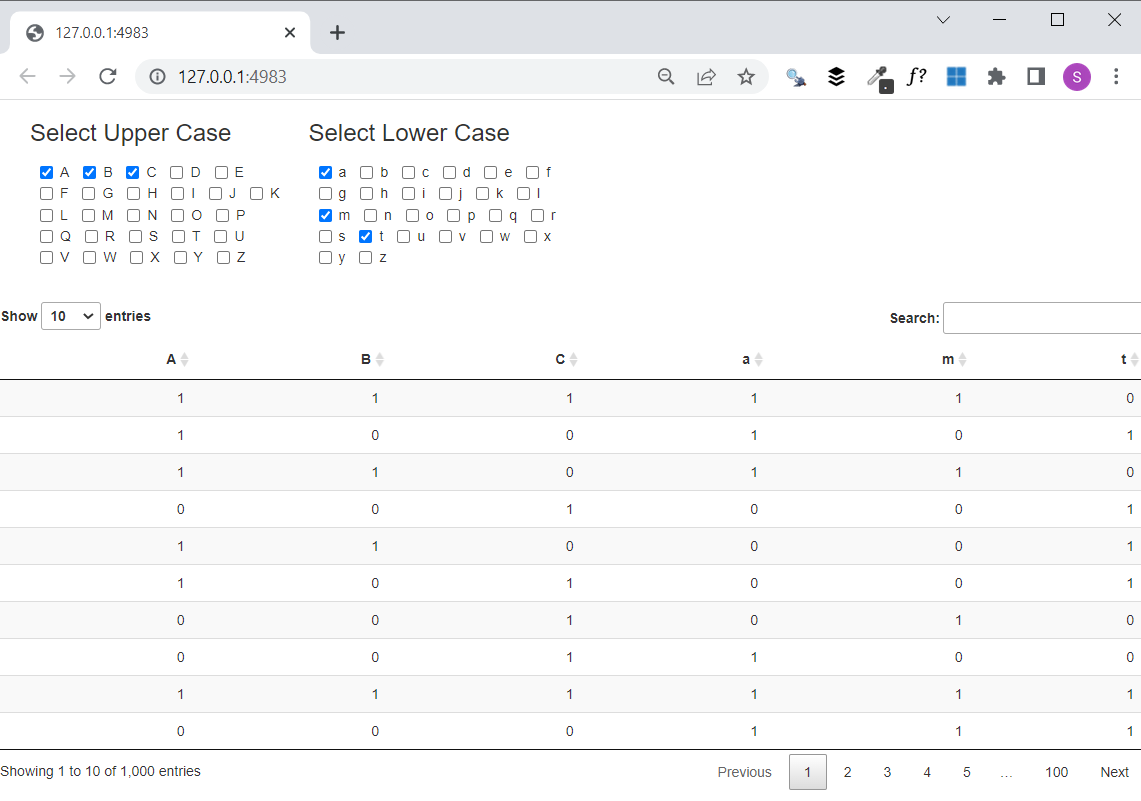
One way would be to split the selections into two separate checkboxGroupInput objects. Then, in the server, the selections from both objects can be combined into one columns vector. To get the left-most input in each row to align, I added CSS at the beginning of the UI within <style> tags. I also set the width of each input to 250px and the column widths to 3 (adjust each of these as desired).
library(shiny)
library(DT)

# Create data frame
column_names_upper <- c(toupper(letters[1:26]))
column_names_lower <- c(tolower(letters[1:26]))
column_names = c(column_names_upper, column_names_lower)
df <- data.frame(replicate(length(column_names),sample(0:1,1000,rep=TRUE)))

# assign column names
colnames(df) = column_names

ui <- fluidPage(

  HTML('<style>
       .checkbox-inline {
         margin-left: 10px;
       }
       </style
       '),

  fluidRow(
    column(3,
           checkboxGroupInput(
             "column_selection_upper",
             h3("Select Upper Case"),
             choices = column_names_upper,
             inline = TRUE,
             selected = c('A','B','C'),
             width = '250px'
           )
           ),

    column(3,
           checkboxGroupInput(
             "column_selection_lower",
             h3("Select Lower Case"),
             choices = column_names_lower,
             inline = TRUE,
             selected = c('A','B','C'),
             width = '250px'
             )
           )
  ),
  br(),
  DT::dataTableOutput("alphabet")
)


# Define server logic required to draw a histogram
server <- function(input, output) {

  output$alphabet <- DT::renderDT({
    columns = column_names
    if (!is.null(input$column_selection_upper) | !is.null(input$column_selection_lower)) {
      columns = c(input$column_selection_upper, input$column_selection_lower)
    }
    datatable(
      df[, columns, drop = FALSE],
      class = "row-border hover stripe",
      rownames = FALSE
    )
  })
}

# Run the application
shinyApp(ui = ui, server = server)
jennyv0
November 22, 2022, 4:17am
3
@scottyd22 Thanks so much!! Just another minor question - is there a way to align the options? So that it's not so free form? In multiple rows perhaps?
This solution on Stack Overflow may provide what you're looking for:
https://stackoverflow.com/questions/29738975
system
January 15, 2023, 5:58pm
5
This topic was automatically closed 54 days after the last reply. New replies are no longer allowed.