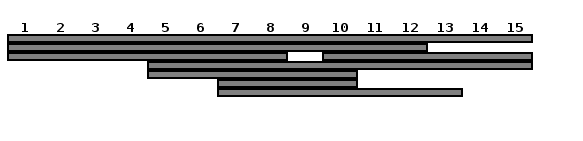
Do you know of a way to reset the height of the bar if there is no overlap? For instance, if we look at the top most bar, it should be placed on the third row from the bottom.
The position along the y-axis is the thing that needs to be determined, and is shown here in the repex only as example.
The idea is to do a optimised stacking of the bars with given ranges to prevent overlap but decrease the total height.
E.g. we have ranges of 1:10, 1:5, 6:11 then in the non-optimal case they would be stacked on top of each other (total height = 3), in the optimal case 1:5 & 6:11 do not overlap with each other (but with 1:10) so they could be located in the same row (next to each other) and stacked on the other one (total height = 2)
In the given example the last bar can/should be moved down to row 3 as there is no overlap (+ some additional space so they can better separated)
I tried it once for myself but didn't come to a solution (or found something on the web) and stopped wasting time on that...
Hey thank you for your suggestion, but I would hope to not have to manually adjust all the segments. These plots can be 300+ rectangles. As previously suggested, I need a way to optimize the placements of each bar. So far the best, I have come up with is :
for(i in 1:nrow(pepmap)){
if(i==1){x=pepmap[i,]}else{
if((pepmap[i,1]>=x[,1])&&(pepmap[i,1] < x[,2])){
pepmap[i,3]=pepmap[i-1,3]+1
}else{x=pepmap[i,]}
}}
Simply starting the height at 1 and with each overlapping bar, I increase the height by 1.