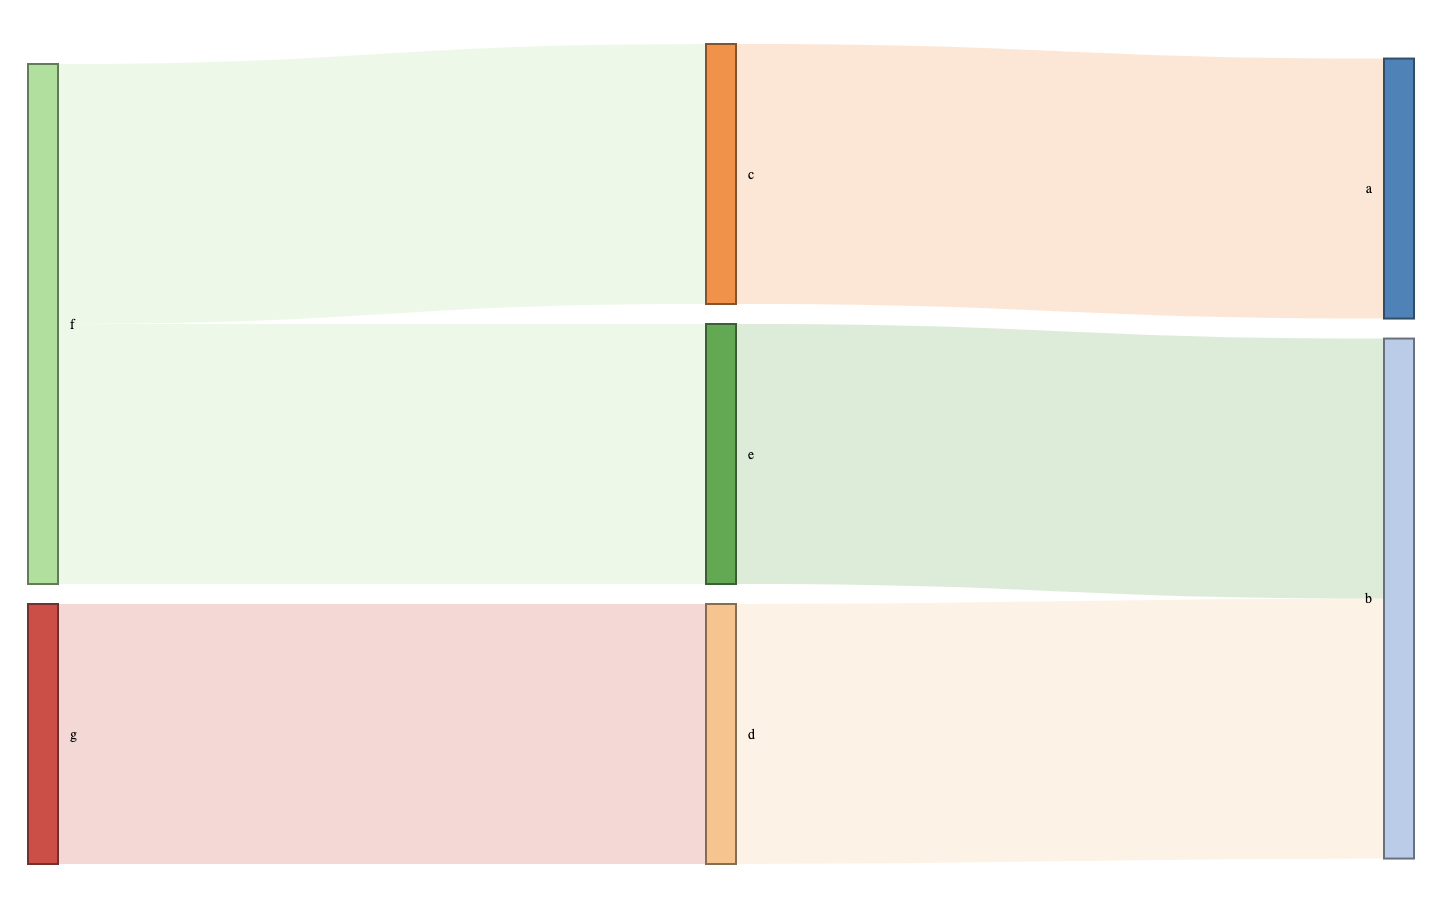
Hello, I was able to create a sankey diagram from a large dataset. However, I am unable to make the "links" colored. I want my links to have the color of the prior node they come from.
Here is my code. I am new to R so I would appreciate a simple explanation. Many thanks.
Load R packages
library(dplyr)
library(tibble)
library(lubridate)
library(sjlabelled)
library(tidyr)
library(networkD3)
library(readr)
library(sjmisc)
library(ggplot2)
library(RColorBrewer)
library(extrafont)
library(stringr)
library(haven)
library (htmlwidgets)
raw_data2 <- nozerosnodup %>%
gather(key, value, -ENROLID, -newmonth) %>%
unite(new.col, c(key, newmonth)) %>%
spread(new.col, value)
character <- c("A")
character_1 <- paste0(character, sep= '_1')
sankey_flow_addnum <-raw_data2 %>%
mutate(newtreat_M1=case_when(newtreat_M1 != ""~paste0(newtreat_M1,sep='_01')),
newtreat_M2=case_when(newtreat_M2 != ""~paste0(newtreat_M2, sep='_02')),
newtreat_M3=case_when(newtreat_M3 != ""~paste0(newtreat_M3, sep='_03')))
sankey_flow_freq <- sankey_flow_addnum %>%
group_by(newtreat_M1,newtreat_M2,newtreat_M3) %>%
summarise(n=n()) %>%
ungroup()
newtreat_M1_M2 <- sankey_flow_freq %>%
select(IN=1, Out=2,4)
newtreat_M2_M3 <- sankey_flow_freq %>%
select(IN=2, Out=3,4)
Sankey_plot_data <- rbind(newtreat_M1_M2, newtreat_M2_M3)
group_by(IN,Out) %>%
summarise(Freq=sum(n)) %>%
ungroup()
nodes <- Sankey_plot_data %>%
select(IN, Out) %>%
pivot_longer(c("IN", "Out"), names_to = "col_name",
values_to="name_match") %>%
select(-1) %>% distinct() %>%
mutate(name=str_sub(name_match, end=-4))
nodes <- data.frame(nodes)
sankey_plot_id <- Sankey_plot_data %>%
mutate(IDIn =match(IN, nodes$name_match)-1,
IDout= match(Out, nodes$name_match)-1)
sankey_plot_id <- data.frame(sankey_plot_id)
sankeyNetwork(Links = sankey_plot_id, Nodes = nodes,
Source = "IDIn", Target = "IDout",
Value = "n", NodeID ="name", fontSize = 25, nodeWidth = 110,
nodePadding = 24)