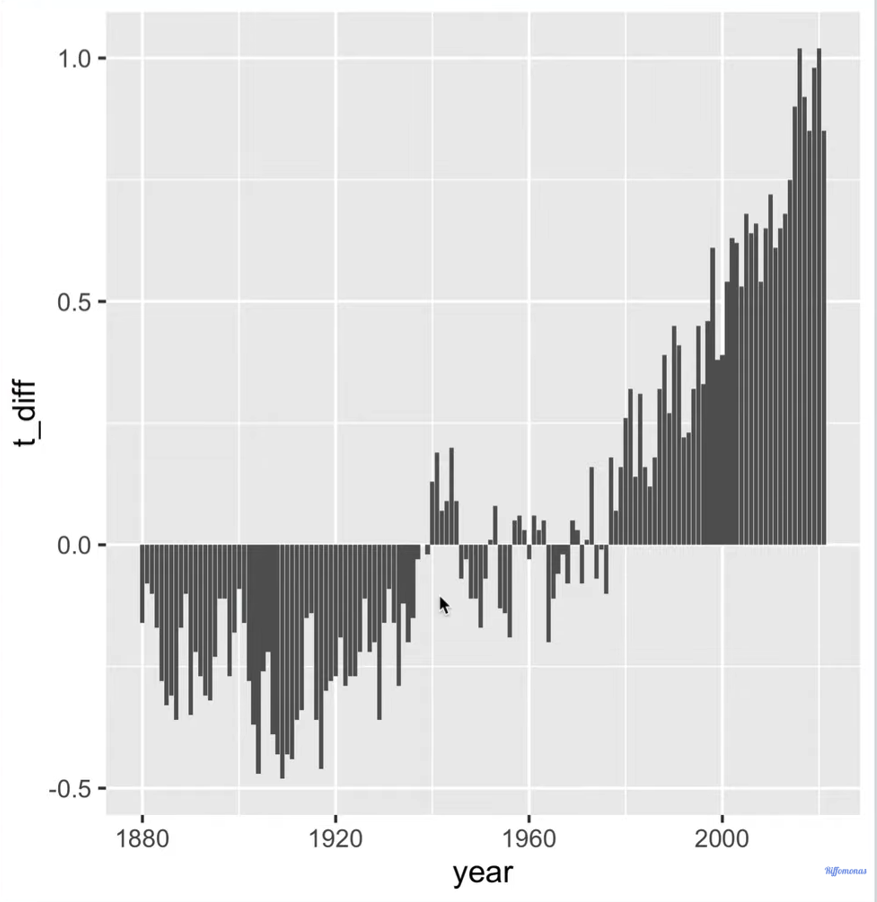
It's a plot from a Riffomonas Project tutorial that shows:
X = YEAR (my dataset goes from 2021 to 2022),
Y = temperatures below and above 0 degrees in Celsius
I've tried merging the columns on Excel and Sheets from Google, but the results I get are either the double of rows in my dataset (the date goes missing in those rows), or the columns merged and separated like this: 18.6 - 12.4
and I don't think that works...
Thank you for reading this and thank you to everyone on this R Community for always being so kind and helpful.
If I interpretted your question correctly it sounds like you want all of the temperature variables in one column, resulting in a longer version of your dataset (twice as long to be exact).
Using the pivot_longer()function can probably help you here. See code below
library(tidyverse)

# using data provided
temperature_data <- tribble(
  ~FECHA,      ~TMAX,  ~TMIN, ~NOMBRE,
  "30/9/2022",  18.6,  12.4, "AEROPARQUE AERO",
  "30/9/2022",  20.6,   0.6, "AZUL AERO",
  "30/9/2022",  24,     7.1, "BAHIA BLANCA AERO",
  "30/9/2022",  16.2,   0.2, "BARILOCHE AERO",
  "30/9/2022", -10.9, -17.1, "BASE BELGRANO II",
  "30/9/2022",   1.6,  -1.4, "BASE CARLINI"
)

# Using the pivot_wider function to combine the temp columns, and assign the
# tmax and tmin variable names to the new MAX-MIN variable
combined_temperatures <- temperature_data %>%
  pivot_longer(cols = c(TMAX, TMIN),
               names_to = "MAX-MIN",
               values_to = "TEMPERATURA")

head(combined_temperatures)

FECHA     NOMBRE            `MAX-MIN` TEMPERATURA
  <chr>     <chr>             <chr>           <dbl>
1 30/9/2022 AEROPARQUE AERO   TMAX             18.6
2 30/9/2022 AEROPARQUE AERO   TMIN             12.4
3 30/9/2022 AZUL AERO         TMAX             20.6
4 30/9/2022 AZUL AERO         TMIN              0.6
5 30/9/2022 BAHIA BLANCA AERO TMAX             24
6 30/9/2022 BAHIA BLANCA AERO TMIN              7.1
The plot you are showing seems to be representing some type of summary of temperature differences by year and the sample data you are showing is for a single day per location, you can't get the same kind of plot with the data you are showing. Can you provide more representative sample data and a clearer explanation of the plot you are trying to make? (Again, please try to provide a proper reprex, even a bad reprex would be better than nothing).
Hello jonesey441, thank you. I followed the steps you gave me, and it worked, but it's temporary, right? Because these changes don't get applied to my dataset (and that's what I'm looking for, but I don't know how to do it)
@22bears , I created a new dataset in my example so you wouldn't alter your original dataset in case you wanted it unaltered for any reason.
If you wish to permanently alter your original dataset, rather than calling a new variable (in my example combined_temperature), simply pass the same name as your original dataset (temperature_data)