I have a data where there is a variable n for each date within a time range. The time range spans multiple years, including the current calendar year to date. My target is to keep a running sum of n for each year and the mean of the running sum for all years, not including the current year to date.
How can I plot this data such that my x-axis scale is a date (like month) and not a numeric day (1-365)?
# package libraries
library(tidyverse)
#> Warning: package 'tidyverse' was built under R version 4.2.2
#> Warning: package 'ggplot2' was built under R version 4.2.2
#> Warning: package 'tibble' was built under R version 4.2.2
#> Warning: package 'tidyr' was built under R version 4.2.2
#> Warning: package 'readr' was built under R version 4.2.2
#> Warning: package 'purrr' was built under R version 4.2.2
#> Warning: package 'dplyr' was built under R version 4.2.2
#> Warning: package 'stringr' was built under R version 4.2.2
#> Warning: package 'forcats' was built under R version 4.2.2
library(lubridate)
#> Warning: package 'lubridate' was built under R version 4.2.2
#> Loading required package: timechange
#> Warning: package 'timechange' was built under R version 4.2.2
#>
#> Attaching package: 'lubridate'
#> The following objects are masked from 'package:base':
#>
#> date, intersect, setdiff, union
# sample data
set.seed(1)
# daily count of an event happening n times each day
sample_time_series <- tibble(
date = seq.Date(
from = date("2000-01-01"),
to = date("2005-04-30"),
by = "day"
),
n = sample(
x = seq(0, 4, 1),
size = 1947,
replace = TRUE
)
)
# some data tidy and transform steps
sample_time_series <- sample_time_series %>%
mutate(
# create new variables for date
date_year = year(date),
date_day = yday(date)
) %>%
group_by(date_year) %>%
summarise(
# calculate cumulative sum for each year
date,
date_day,
n,
n_cum = cumsum(n)
) %>%
ungroup() %>%
group_by(date_day) %>%
summarise(
# calculate mean of cumulative sum for all years
date_year,
date,
n,
n_cum,
n_mean = mean(n_cum)
) %>%
ungroup() %>%
arrange(date) %>%
mutate(
group = if_else(
condition = date_year == 2005,
true = "B", # historical
false = "A" # year to date
)
)
#> `summarise()` has grouped output by 'date_year'. You can override using the
#> `.groups` argument.
#> `summarise()` has grouped output by 'date_day'. You can override using the
#> `.groups` argument.
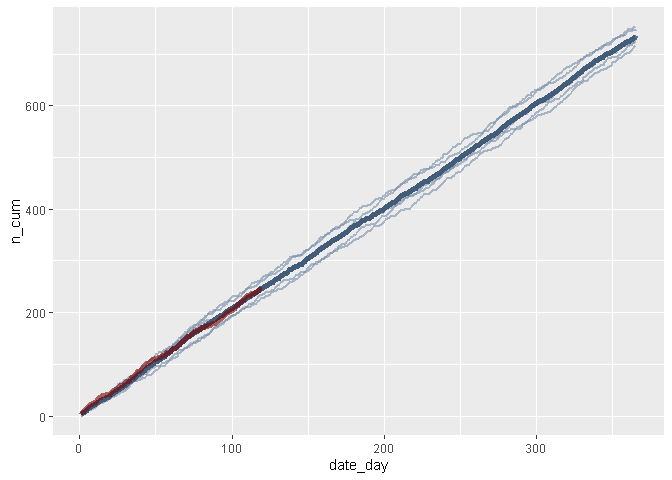
# plot with three layers
ggplot() +
geom_line(
# cumulative sum for group A
data = sample_time_series[sample_time_series$group == "A", ],
mapping = aes(
x = date_day,
y = n_cum,
group = as_factor(date_year)
), color = "#778da9",
linewidth = 1,
alpha = 3/5
) +
# mean for group A
geom_line(
data = sample_time_series[sample_time_series$group == "A", ],
mapping = aes(
x = date_day,
y = n_mean,
group = as_factor(date_year)
), color = "#415a77",
linewidth = 2,
alpha = 3/5
) +
geom_line(
# cumulative sum for group B
data = sample_time_series[sample_time_series$group == "B", ],
mapping = aes(
x = date_day,
y = n_cum,
group = as_factor(date_year)
), color = "#780000",
linewidth = 2,
alpha = 3/5
) # how does my x-scale become a date?
Created on 2023-05-15 with reprex v2.0.2