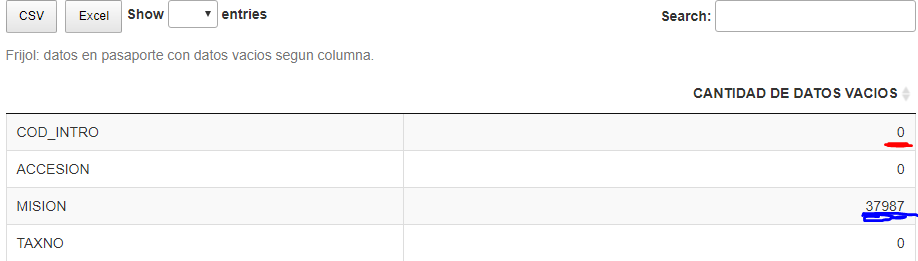
Hi community
Im want make better this table. Im want put color when the values are 0 and different to 0.
library(tidyverse)
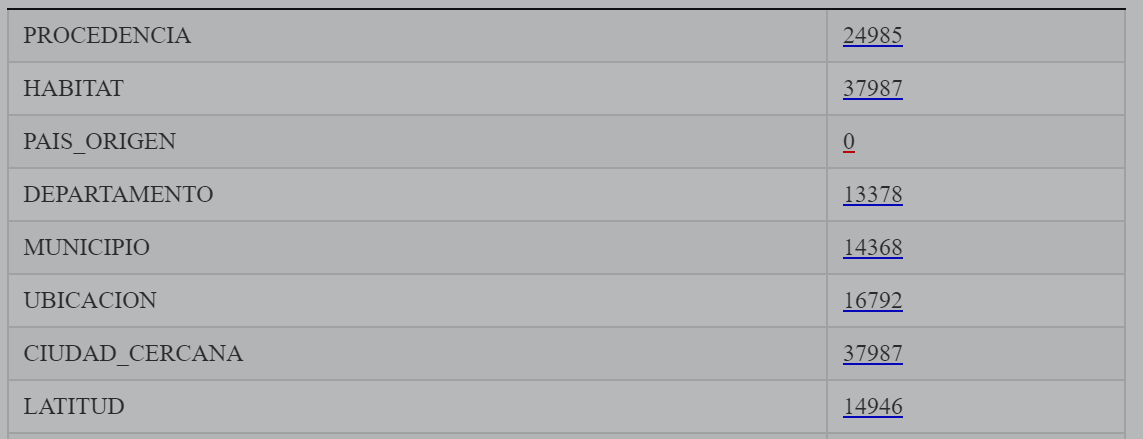
data <- structure(list(`CANTIDAD DE DATOS VACIOS` = c(0L, 0L, 37987L,
0L, 0L, 0L, 49L, 0L, 37987L, 0L, 24985L, 37987L, 0L, 13378L,
14368L, 16792L, 37987L, 14946L, 14943L, 22868L, 0L, 10L, 0L,
5142L, 29553L, 18306L, 0L, 37987L, 37987L, 0L, 34163L, 37987L,
37987L, 37987L, 37987L, 37987L, 37987L, 37987L, 37987L, 36268L,
37987L, 37987L, 0L, 0L, 37938L)), class = "data.frame", row.names = c("COD_INTRO",
"ACCESION", "MISION", "TAXNO", "GENERO", "ESPECIE", "DESIGNADA_FAO",
"EST_BIOLOGICO", "ESTADO", "HABITO", "PROCEDENCIA", "HABITAT",
"PAIS_ORIGEN", "DEPARTAMENTO", "MUNICIPIO", "UBICACION", "CIUDAD_CERCANA",
"LATITUD", "LONGITUD", "ALTITUD", "PAIS_DONANTE", "TECNICO_DONANTE",
"INSTITUCION_DONANTE", "RESPONSABLE", "OBSERVACION", "F_RECOLECCION",
"F_RECIBO", "F_REGISTRO", "F_ACTUALIZACION", "UNIDAD_MED", "CANT_COLECTADAS",
"TOPOGRAFIA", "TIPO_SITIO", "TEXTURA", "DRENAJE", "TIPO_SUELO",
"LLUVIA", "MESES_SECOS", "NOMBRE_RESP", "CORE", "DETERMINADOR",
"F_DETERMINADOR", "MLSSTAT", "DOI", "HISTORIC"))
library(DT)
data %>%
datatable(extensions = 'Buttons',
class = 'cell-border stripe',
caption = 'crop: datos vacios segun columna.',
options = list(dom = 'Blfrtip',
buttons = c('csv', 'excel'),
lengthMenu = list(c(10,25,50,-1),
c(10,25,50,"All")),
pageLength = 45))
Tnks!