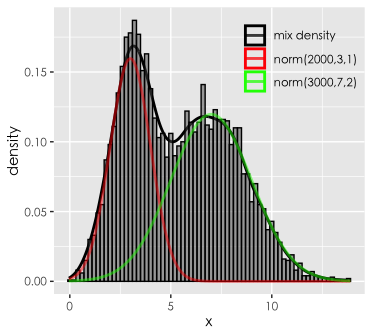
I am drawing a probability density map for a mixed distribution, but the legend line has a border that I want to remove. May I know what to do
library(ggplot2)
library(stringr)
rm(list=ls())
set.seed(123)
n <- 5000
mu1 <- 3
sigma1 <- 1
mu2 <- 7
sigma2 <- 2
pi1 <- 0.4
pi2 <- 0.6
x1 = rnorm(n * pi1, mean = mu1, sd = sigma1)
x2 = rnorm(n * pi2, mean = mu2, sd = sigma2)
x <- c(x1, x2)
x11 = seq(min(x1), max(x2),length.out = n)
y11 = pi1 * dnorm(x11, mean = mu1, sd = sigma1)
y22 = pi2 * dnorm(x11, mean = mu2, sd = sigma2)
p0 = theme(text = element_text(family = 'STHeitiSC-Light'),
plot.title = element_text(hjust = 0.5),
legend.position = c(1, 1),
legend.justification = c(1, 1),
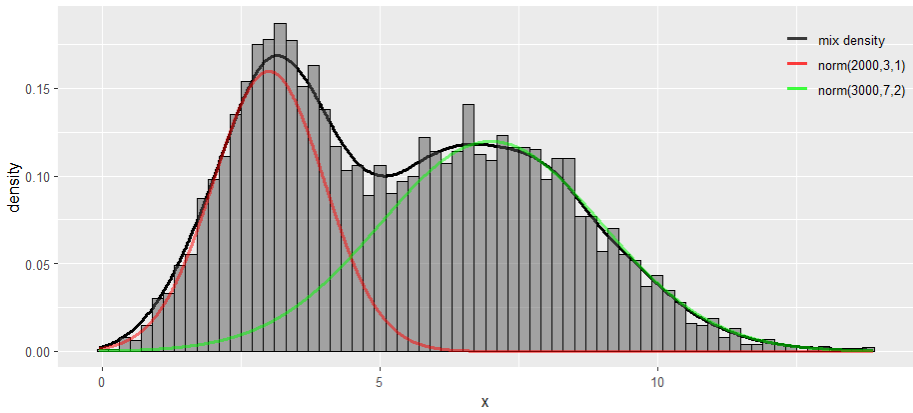
legend.key=element_blank(),
legend.background = element_rect(fill = "transparent"))
ggplot(data = NULL, aes(x = x)) +
geom_density(aes(colour = "Density"), linewidth = 1, alpha = 0.5) +
geom_histogram(aes(y = after_stat(density)), binwidth = 0.2, colour = "black", alpha = 0.5) +
geom_line(aes(x = x11, y = y11, colour = "Line 1"), linewidth = 1, alpha = 0.5) +
geom_line(aes(x = x11, y = y22, colour = "Line 2"), linewidth = 1, alpha = 0.5) +
scale_color_manual(name = element_blank(),
values = c("Density" = "black", "Line 1" = "red", "Line 2" = "green"),
labels = c("mix density",
str_glue("norm({n * pi1},{mu1},{sigma1})"),
str_glue("norm({n * pi2},{mu2},{sigma2})") )) + p0