Hello,
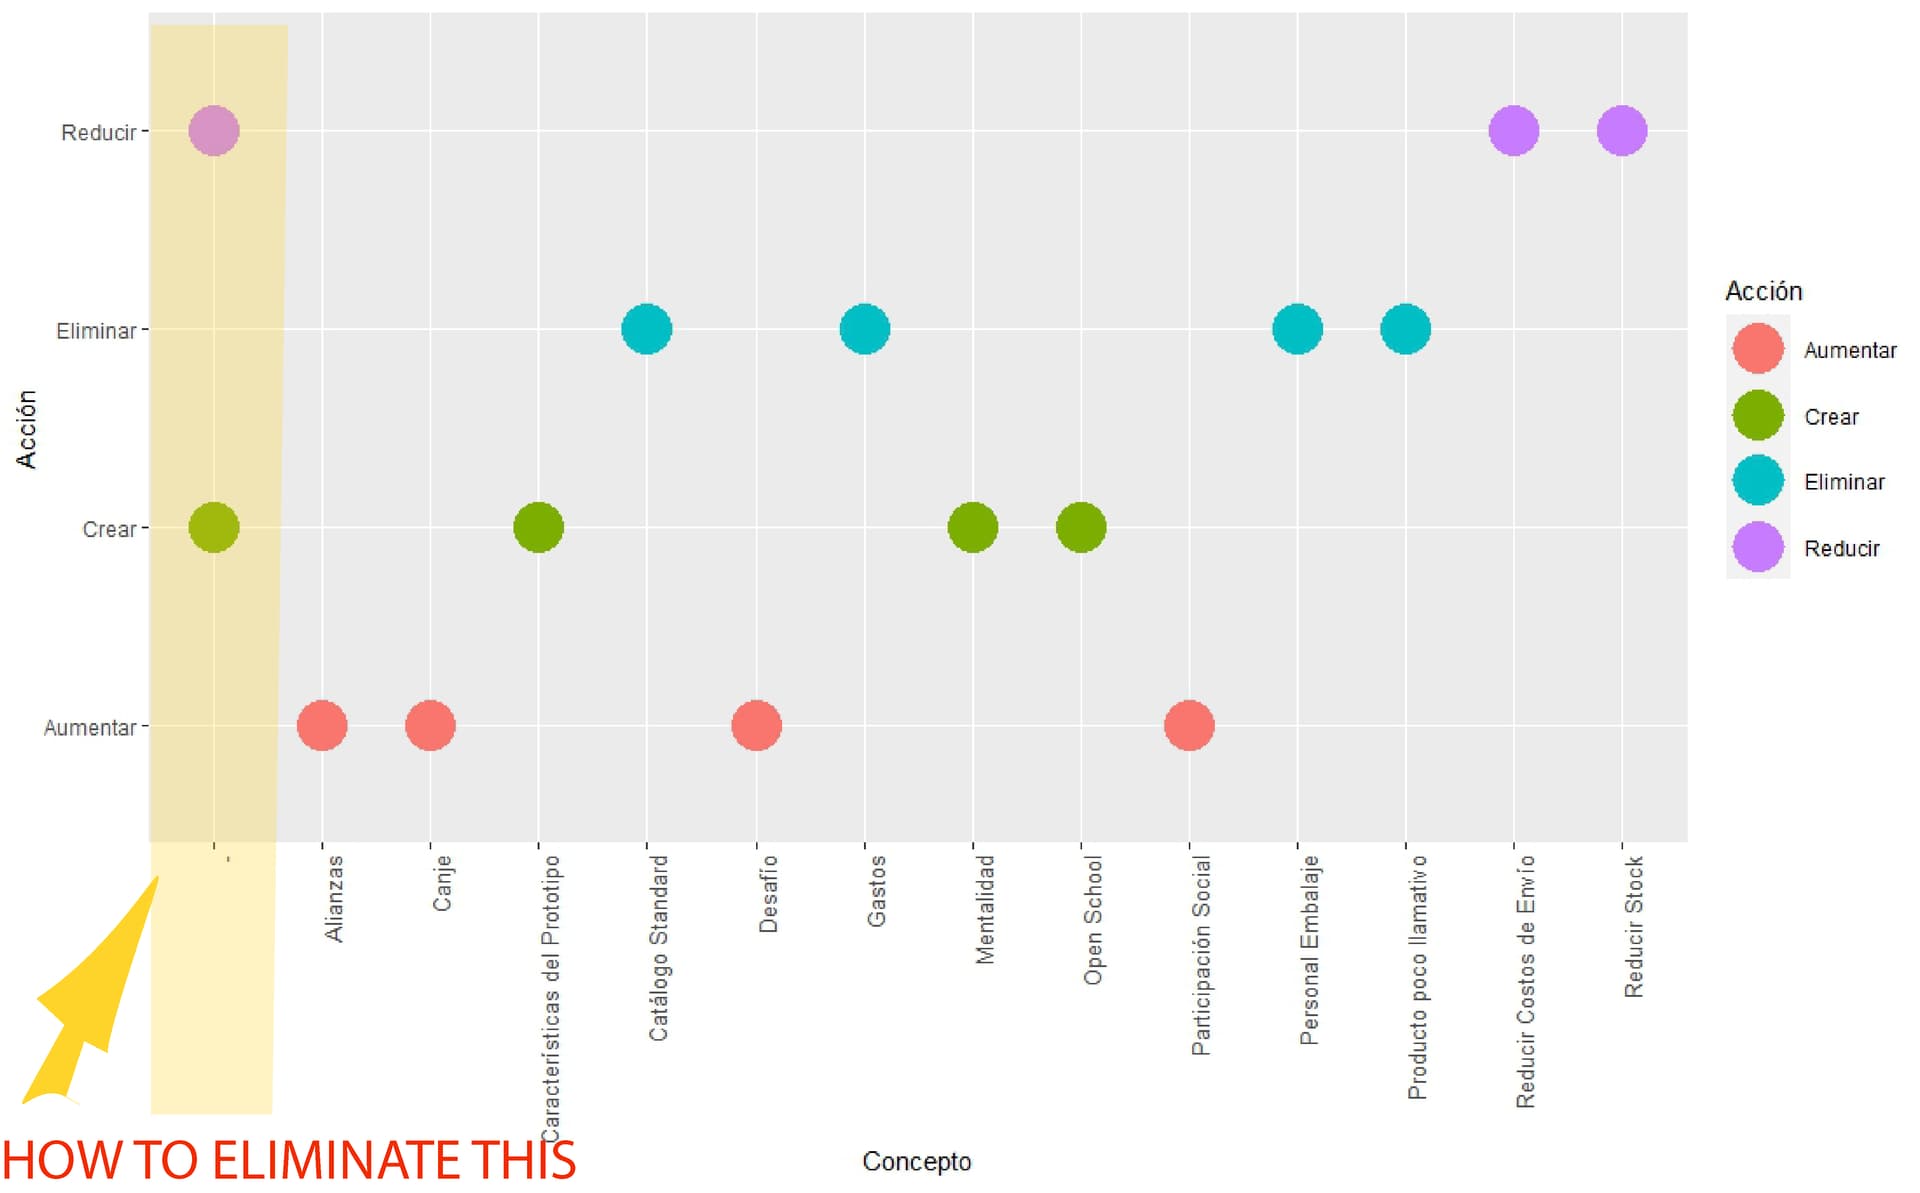
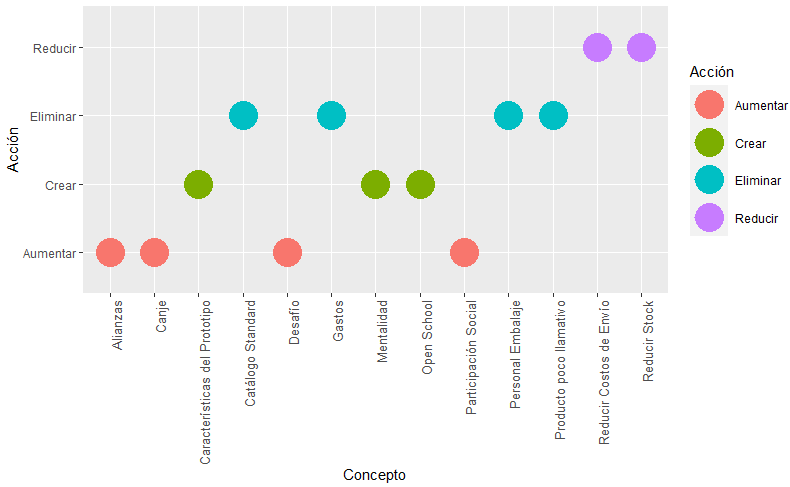
I hope you are very well, I need help how to eliminate these points or modify the dataframe with NULL´s, so obtain an optimus plot or similar or better.
Thanks!
You can run this:
df <- data.frame(Concepto = c("Gastos", "Personal Embalaje", "Producto poco llamativo", "Catálogo Standard",
"Canje", "Desafío", "Participación Social", "Alianzas",
"Reducir Stock","Reducir Costos de Envío", "-", "-",
"Mentalidad", "Open School", "Características del Prototipo", "-"),
Acción = c("Eliminar", "Eliminar","Eliminar","Eliminar", "Aumentar", "Aumentar", "Aumentar","Aumentar",
"Reducir", "Reducir", "Reducir", "Reducir", "Crear", "Crear", "Crear", "Crear"),
Nota = c(0,0,0,0,10,10,10,10,5,5,5,5,9,9,9,9))
df
ggplot(data = df, aes(x = Concepto, y = Acción)) +
geom_line(aes(color = Acción))+
geom_point(size = 10, aes(color = Acción))+
theme(axis.text.x = element_text(angle = 90, hjust=1,vjust=1, size = 10))