Greeting to all.
I have the following questions:
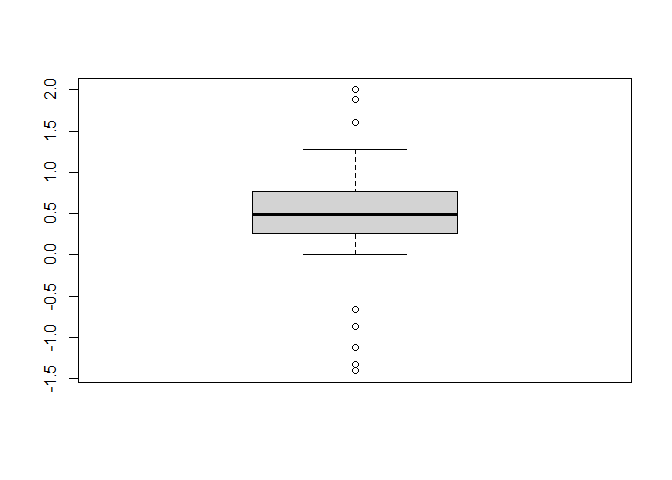
As you can see, in my data, there are some outliers , seen and recognised from the BoxPlot diagram.
How can i detect and remove them?
Also, how can i detect and remove AND the spatial outliers, in order to execute spatial interpolation techniques? (e.g. kriging)
Hello,
A boxplot is built like this
That means that everything below the min (< Q1 - 1.5*IQR) or above the max (> Q3 + 1.5*IQR) is considered an outlier. With this in mind we can then create a simple function to return for a vector of values whether they are an outlier or not:
set.seed(4) #For reproducibility

#Generate random data with outliers
x = runif(250)
x[sample(1:250, 10)] = c(runif(5, -1.5, -0.5), runif(5, 1, 2))

#Boxplot
boxplot(x)
#Outlier function
outlier = function(x){

  IQR = quantile(x, prob = c(0.25, 0.75))
  IQR[3] = IQR[2] - IQR[1]

  return(ifelse(x < IQR[1] - 1.5*IQR[3] | x > IQR[2] + 1.5*IQR[3], T, F))
}

#list outliers
outlier(x)
#>   [1] FALSE FALSE FALSE FALSE FALSE FALSE FALSE  TRUE FALSE FALSE FALSE FALSE
#>  [13] FALSE  TRUE FALSE FALSE FALSE FALSE FALSE FALSE FALSE FALSE FALSE FALSE
#>  [25] FALSE FALSE FALSE FALSE FALSE FALSE FALSE FALSE FALSE FALSE FALSE FALSE
#>  [37] FALSE FALSE FALSE FALSE FALSE FALSE FALSE FALSE FALSE FALSE FALSE FALSE
#>  [49] FALSE FALSE FALSE FALSE FALSE FALSE FALSE FALSE FALSE FALSE FALSE FALSE
#>  [61] FALSE FALSE  TRUE FALSE FALSE FALSE FALSE FALSE FALSE FALSE FALSE FALSE
#>  [73] FALSE FALSE FALSE FALSE FALSE FALSE FALSE  TRUE FALSE FALSE FALSE FALSE
#>  [85] FALSE FALSE FALSE FALSE FALSE FALSE FALSE FALSE FALSE FALSE FALSE FALSE
#>  [97] FALSE FALSE FALSE FALSE FALSE FALSE FALSE FALSE FALSE FALSE FALSE FALSE
#> [109] FALSE FALSE FALSE FALSE  TRUE FALSE FALSE FALSE FALSE FALSE FALSE FALSE
#> [121] FALSE FALSE FALSE FALSE FALSE  TRUE FALSE FALSE  TRUE FALSE FALSE FALSE
#> [133] FALSE FALSE FALSE FALSE FALSE FALSE FALSE FALSE FALSE FALSE FALSE FALSE
#> [145] FALSE FALSE FALSE FALSE FALSE FALSE FALSE FALSE FALSE FALSE FALSE FALSE
#> [157] FALSE FALSE FALSE FALSE FALSE FALSE FALSE FALSE FALSE FALSE FALSE FALSE
#> [169] FALSE FALSE FALSE FALSE FALSE FALSE FALSE FALSE FALSE FALSE FALSE FALSE
#> [181] FALSE FALSE FALSE FALSE FALSE FALSE FALSE FALSE FALSE FALSE FALSE FALSE
#> [193] FALSE FALSE FALSE FALSE FALSE FALSE FALSE FALSE FALSE FALSE FALSE FALSE
#> [205] FALSE FALSE FALSE FALSE FALSE FALSE FALSE FALSE FALSE FALSE FALSE FALSE
#> [217]  TRUE FALSE FALSE FALSE FALSE FALSE FALSE FALSE FALSE FALSE FALSE FALSE
#> [229] FALSE FALSE FALSE FALSE FALSE FALSE FALSE FALSE FALSE FALSE FALSE FALSE
#> [241] FALSE FALSE FALSE FALSE FALSE FALSE FALSE FALSE FALSE FALSE

#Total outliers (verify on plot)
sum(outlier(x))
#> [1] 8
Created on 2023-01-10 with reprex v2.0.2
You can see that the functions detects 8 outliers, which is corresponding with what you can see on the plot.
NOTE: Removing the outliers and plotting again will change the boxplot shape and can create new outliers as the data has changed.
Hope this helps,
1 Like
system
February 21, 2023, 1:03pm
3
This topic was automatically closed 42 days after the last reply. New replies are no longer allowed.