Big question. Here's how I'd approach it at a big level of generality, without knowing the nature of the organization's data, the types of analyses it runs, the analytic sophistication applied and the level of devotion to embellishing results to make things look pretty.
Origin story. Linuxand R both derive from software developed in-house at Bell Labs during the 1970s—UNIX and S.
The fisrt came about because some guys found getting computer time inconvenient. They scrounged a cast-off computer that didn't have an operating system. So, one guy did that, another guy invented C and others pitched in with a design for a shell, a text parser, a language to make flat files usable as databases and make reports. bash, grep, awk and dozens of others that were recreated in GNU, BSD and the other derivatives. Imagine a world where all of these tools had to be withdrawn from circulation. There would literally be no internet. One of those guys, Brian Kernighan has written UNIX: A History of Memoir tells the backstory.
I should mention that Bell Labs staff have racked up nine Nobel Prizes, five Turing Awards, and 22 IEEE Medals of Honor. For things like the transistor, information theory, discovering the cosmic background radiation, fast Fourier transforms. Not to mention the collection of Emmys, Grammys and Oscars.
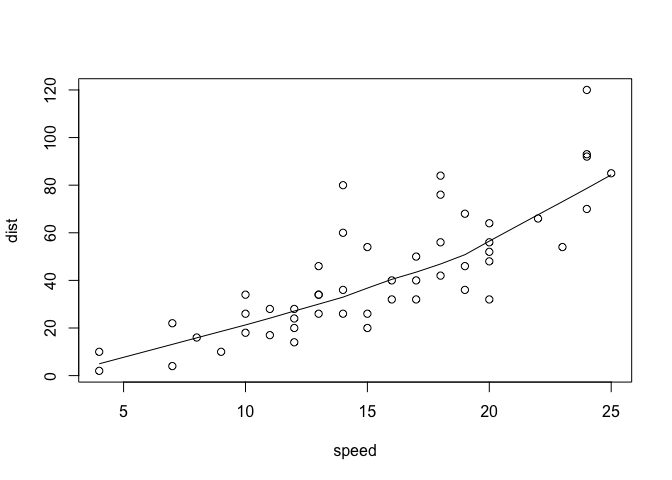
One of the staff statisticians, John W. Tukey, pushed a practice of exploratory data analysis as a necessary component to understand the questions that a data set could answer before trying to make the data confirm something it could not. The nature of EDA is somewhat spontaneous and unstructured compared to confirmatory statistics. While the statistics department had a robust library of Fortran for a large set of statistical tasks, using it could be inconvenient for problems such as running a quick linear regression of a few dozen x,y points. As Richard Becker put it
The idea of writing a Fortran program that called library routines for something like this was unappealing. While the actual regression was done in a single subroutine call, the program had to do its own input and output, and time spent in I/O often dominated the actual computations. Even more importantly, the effort expended on programming was out of proportion to the size of the problem. An interactive facility could make such work much easier.
But realizing a tool for that ease of use wasn't trivial. Developing an interactive front-end not only a lot of under-the-hood stuff but also a design decision to make S (which became open-sourced as R) a functional language based on a formal grammar with few restrictions and a data structure in built as vectors of like-elements: numbers, character strings, or logical values. Along the way functions became first class objects, the result of which is that an elaborate macro process for compiling in new functions to the language itself was replaced with an in-process solution. Then came the ability to link to system libraries to import implementation of algorithms written in FORTRAN and other languages.
S became a mainstay for the statistics department for ad hoc projects and as word got out into the larger community, requests for it grew. But, as it was hard to port from one OS to another, the solution was hit upon to have it hitch a ride on UNIX, which was also in the process of disseminating broadly. Eventually, it was made available commercially.
During the course of its evolution is was being used by statisticians who were only incidentially developers, the Dog Food model. From Richard Becker, again,
If we hadn’t considered S our primary research tool, we would probably not have kept it up-to-date with the latest algorithms and statistical methods. S has always had new methodology available quickly, at least in part because it was designed to be extended by users as well as its originators.
That is a decent pedigree for a domain specific language designed to be used interactively by statisticians and to accommodate new algorithms developed by statistics. It was a monumental accomplishment also in light that it was the part-time work of a small core team.
That work has been carried on in the open-source version, R by some of the original participants of S and a worldwide group of other statisticians and computer scientists since 1994.
R quickly overtook the installed base of S and has an ever-growing population of packages—10^4 and counting. Over the nearly 30 years it has been in the wild, Darwin has been at work with packages coming into view and surviving to be co-opted into the language, as happened with {magrittr}s %>% which became |>. Unsuccessful packages recede into the dim background for lack of maintenance. Successful packages get massively stress tested by real-world use and issues percolate through venues such as stackoverflow and on to bug reports.
Long wind-up for the pitch: The good and bad news is that for any particular algorithm there is usually more than one choice and often several. It can feel like a foodie dying of starvation while trying to finish reading the menu.
Let's divide the menu into courses.
- Undergrad textbook stuff
- Graduate textbook stuff
- Publish or perish stuff
- Subject matter stuff
- User-friendly stuff
- Eye candy
Let's dispose of the two auxiliary cases.
For user friendly there is pre-eminently the tidyverse. It has become what most people think of in connection with R. It does a great job of overcoming our past trauma with punctuation based symbolic manipulation that we carry over from school algebra. It has two drawbacks, however. First, it nudges the language in a procedural/imperative direction—do this then do that. Second, doing so misdirects the users attention from thinking about whether some plan of analysis actually does to carry out the purpose of the coding problem to how to get a particular sequence of steps to run without throwing an error. Functions in {base} throw simpler errors because there is less syntax to thread. Whether to encourage that depends on the user base and the willingness of the designated support person to help with problems that could be simpler.
Decoration, embellishment, interactivity, dashboards, KPI animations and dot plots with smiley faces have become pervasive interests of a large part of the user base. I'll leave that just with a reference to Edward Tufte's Cognitive Style of Power Point.
Next is substantive domain stuff. The {bioconductor} space for life sciences is the biggest example. The whole econometrics field labors in a garden of packages of their own. The economists, in particular, seem to feel compelled to invent their own terminology and variation for standard technique. There are hosts of smaller examples, which you can see in CRAN task views or with {ctv}. In searching using correlation as a keyword, you might run across {powerSurvEpi}
Functions to calculate power and sample size for testing main effect or interaction effect in the survival analysis of epidemiological studies (non-randomized studies), taking into account the correlation between the covariate of the interest and other covariates.
If your organization doesn't do epidemiology, why even check this out?
My recommendation is that in considering any tool not otherwise settled upon, check the task view characterization and the description headline. You probably don't need it.
Next, let's knock off the cutting edge stuff.
Package GeeWhiz implements a novel algorithm for the detection of time-varying quandoids as described by Feather, Bed and Spread in their 2023 preprint.
Why go there?
That leaves basic and advanced textbook stuff, bread and butter work.
The basic stuff is all captured by the standard packages brought in by installation. Almost definitionally, none of that stuff can be wrong. A better cor(), lm(), shapiro.test? On a standalone basis, probably not. As part of a workflow package to bring in data and push it out in a particular tabular layout, other packages may have some advantage. But let those come to you, don't seek them out.
By this time, most of the graduate level standard texts have related R packages. Want a comprehensive set of regression tools? Get Frank Harrell's Regression Modeling Strategies and the accompanying {rms} package (and {Hmisc} in any event). Just one example.
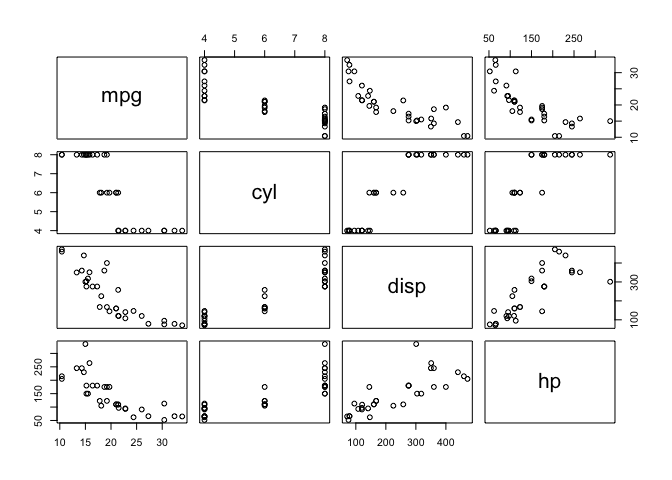
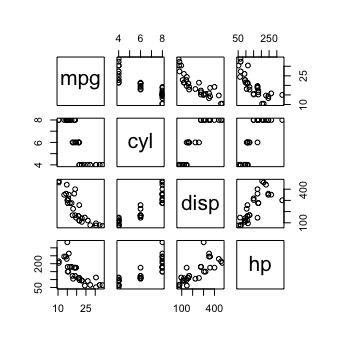
Finally, consider how your users are going to be working. Let's take one of the standard EDA tools using two tools to look at the relationships among four variables in a data frame
with pairs(mtcars[1:4])
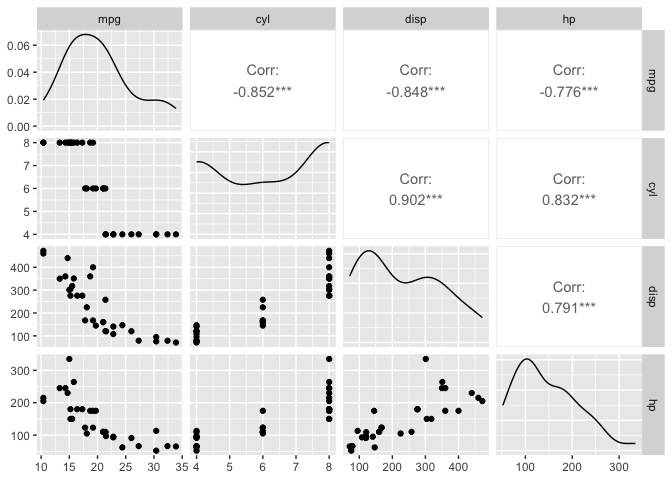
and with GGally::ggpairs(mtcars[1:4]
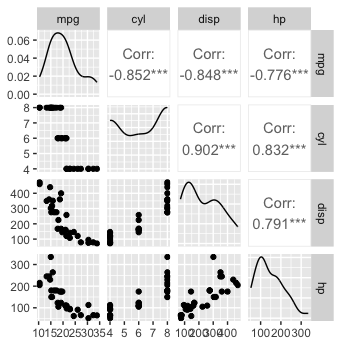
To me, it's a matter of personal preference and the stage at which I am in the analysis. For a first peak, I'd probably use pairs(); later a closer look with ggpairs() might be helpful.
When I run across the package that I want to take home to meet the parents, my checklist
- How mature is it?
- How complicated are its dependencies?
- Is it a vanity project or the work of a community?
- What other packages suggest it?
- Characterized in a task view?
- Associated Journal of Statistical Software introductory article?
- Source of algorithms cited or original algorithms adequately described?
- How well documented?
- Discussions in repo or forums?
Start small and get experience with the defaults. Identify any gotta have enhancements and look for a user-installed package. Evaluate and run tests. Read the source if indicated.