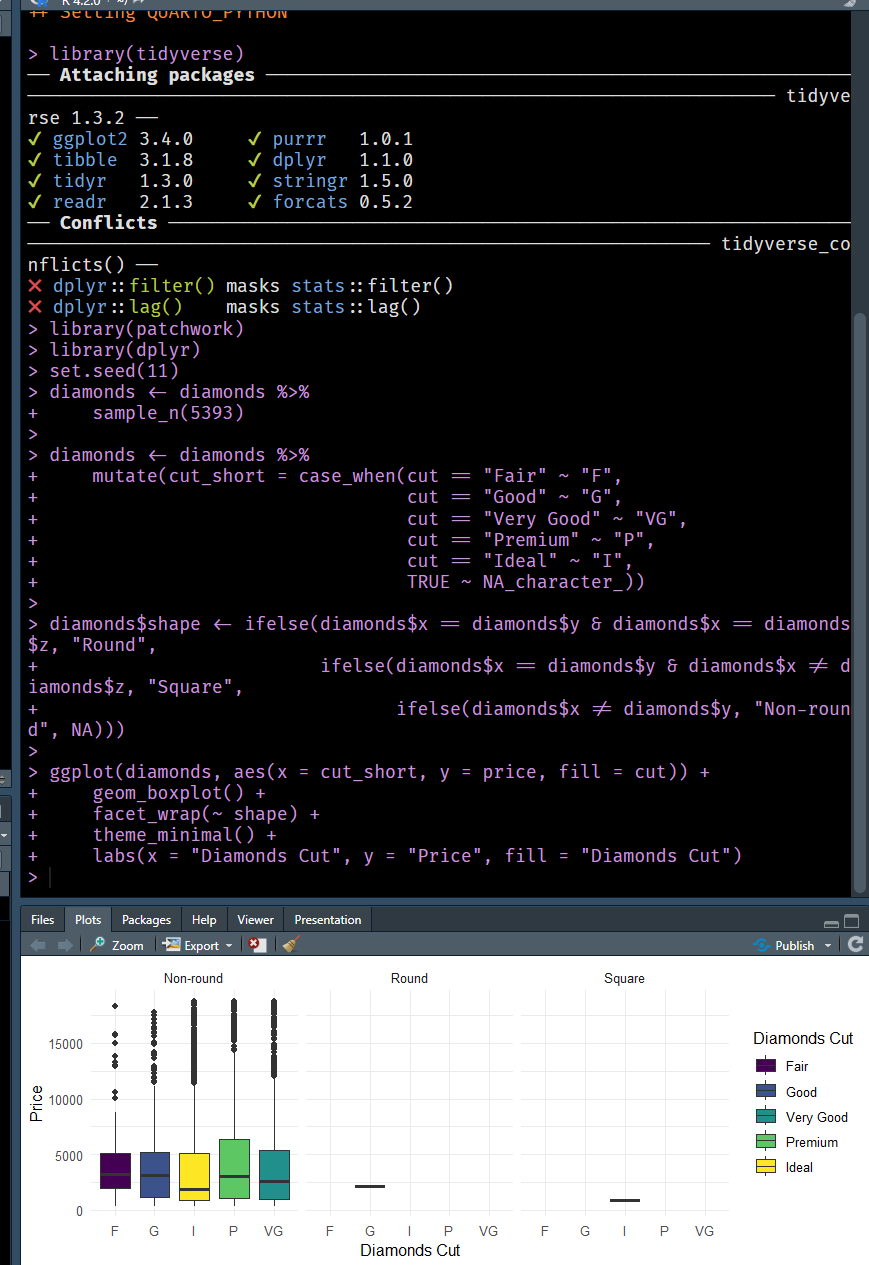
When knit to HTML my chart is missing some value? How to solve kind of this issue?
library(tidyverse)
library(patchwork)
library(dplyr)
set.seed(11)
diamonds <- diamonds %>%
sample_n(5393)
diamonds <- diamonds %>%
mutate(cut_short = case_when(cut == "Fair" ~ "F",
cut == "Good" ~ "G",
cut == "Very Good" ~ "VG",
cut == "Premium" ~ "P",
cut == "Ideal" ~ "I",
TRUE ~ NA_character_))
diamonds$shape <- ifelse(diamonds$x == diamonds$y & diamonds$x == diamonds$z, "Round",
ifelse(diamonds$x == diamonds$y & diamonds$x != diamonds$z, "Square",
ifelse(diamonds$x != diamonds$y, "Non-round", NA)))
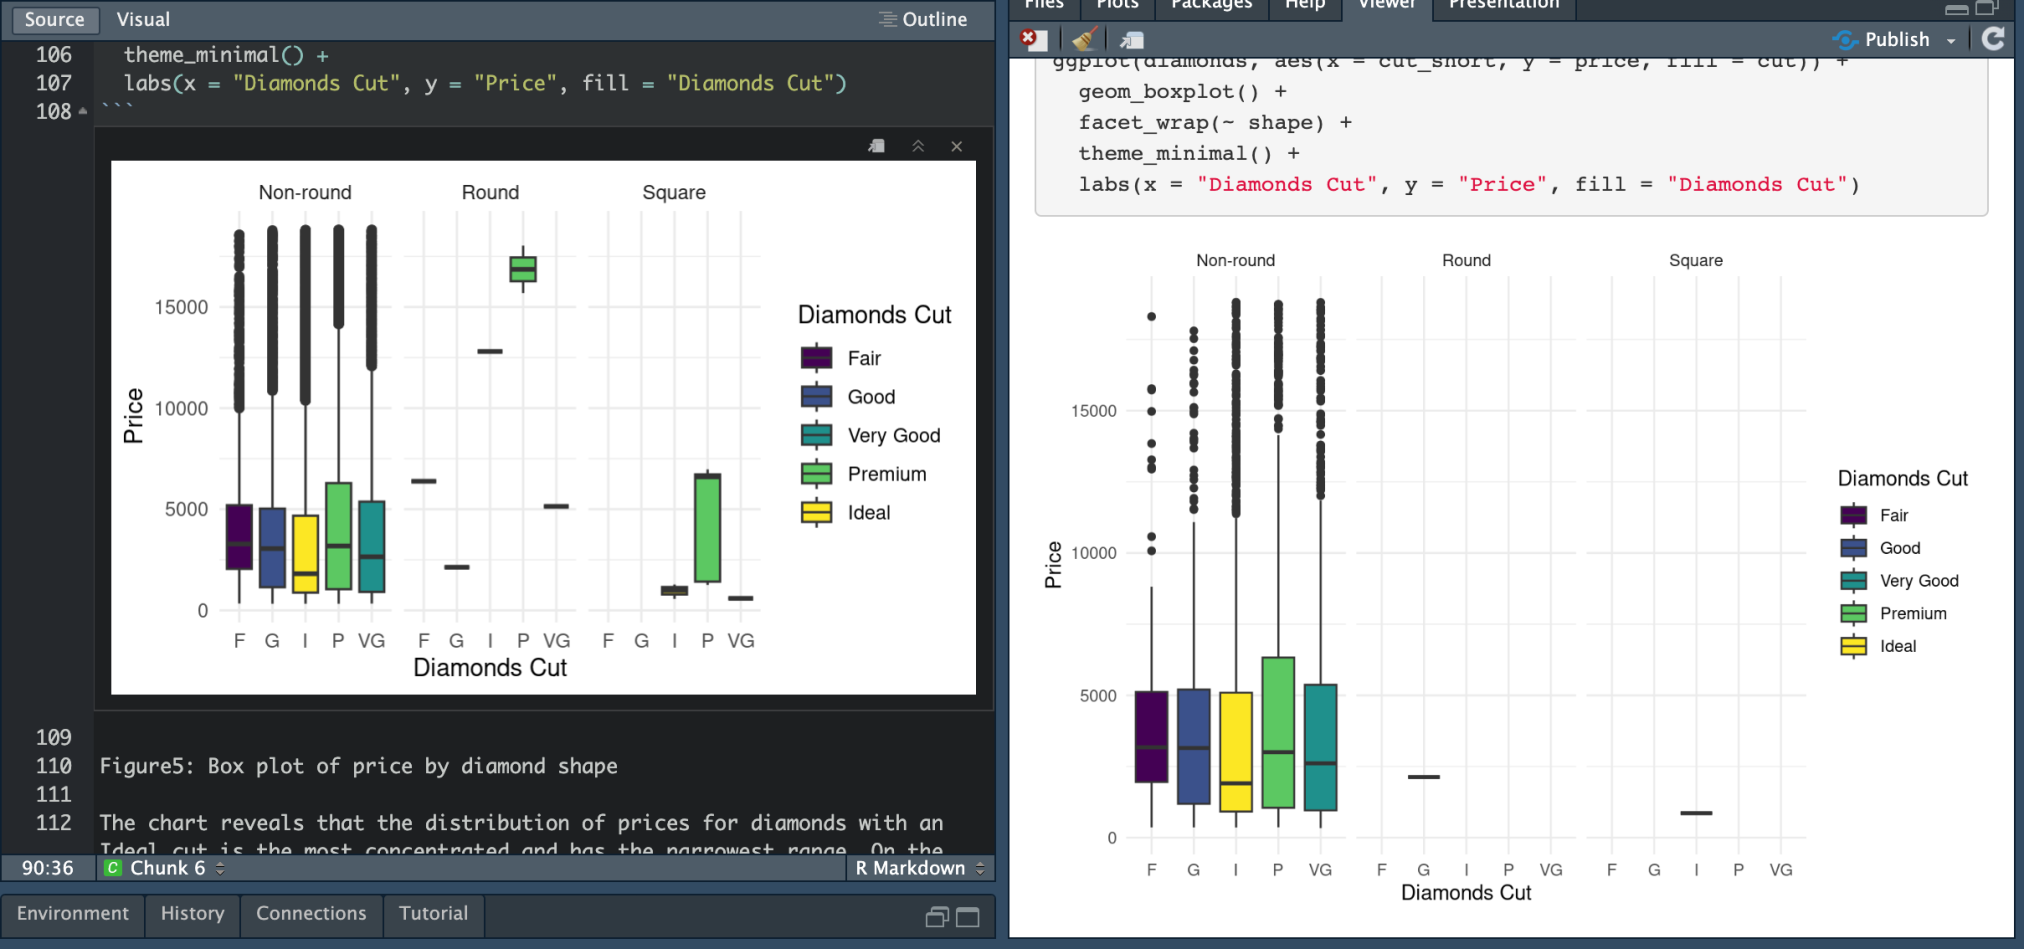
ggplot(diamonds, aes(x = cut_short, y = price, fill = cut)) +
geom_boxplot() +
facet_wrap(~ shape) +
theme_minimal() +
labs(x = "Diamonds Cut", y = "Price", fill = "Diamonds Cut")