How to transform my dataframe for a multiple line plot ?

I have a dataframe, df:

df=data.frame("temp"=c(60.80,46.04,26.96,24.98),"humid"=c(93.79,53.33,50.34,54.65),"wind_speed"=c(40.27,39.12,14.96, 13.81), "date" =c("2013-01-01","2013-01-01","2013-01-02", "2013-01-02"))

df$date <- as.Date(df$date, "%Y-%m-%d")


  temp   humid    wind_speed      date

1 60.80  93.79     40.27          2013-01-01
2 46.04  53.33     39.12          2013-01-01
3 26.96  50.34     14.96          2013-01-02
4 24.98  54.65     13.81          2013-01-02

I want it to look like this:

  variable    value          date

  temp        60.80          2013-01-01
  temp        46.04          2013-01-01
  temp        26.96          2013-01-02
  temp        24.98          2013-01-02
  humid       93.79          2013-01-01  
  humid       53.33          2013-01-01
  humid       50.34          2013-01-02
  humid       54.65          2013-01-02
  wind_speed  40.27          2013-01-01
  wind_speed  39.12          2013-01-01
  wind_speed  14.96          2013-01-02
  wind_speed  13.81          2013-01-02

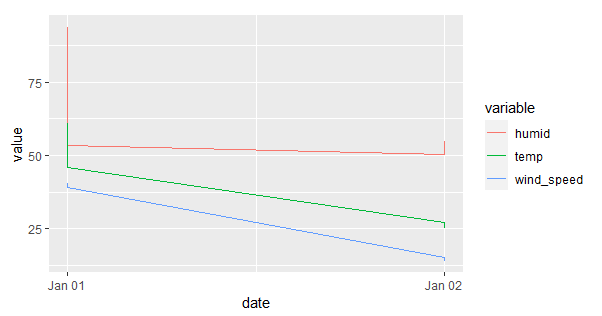
How can I transform my dataframe so I could draw several lines in the same plot ?

Like in this code:

library(ggplot2)
library(lubridate)
theme_set(theme_bw())

df <- economics_long[economics_long$variable %in% c("psavert", "uempmed"), ]
df <- df[lubridate::year(df$date) %in% c(1967:1981), ]

# labels and breaks for X axis text
brks <- df$date[seq(1, length(df$date), 12)]
lbls <- lubridate::year(brks)

# plot
ggplot(df, aes(x=date)) + 
  geom_line(aes(y=value, col=variable)) + 
  labs(title="Time Series of Returns Percentage", 
       subtitle="Drawn from Long Data format", 
       caption="Source: Economics", 
       y="Returns %", 
       color=NULL) +  # title and caption
  scale_x_date(labels = lbls, breaks = brks) +  # change to monthly ticks and labels
  scale_color_manual(labels = c("psavert", "uempmed"), 
                     values = c("psavert"="#00ba38", "uempmed"="#f8766d")) +  # line color

answer to your first question, transformed data frame by

library(reshape2)
xymelt <- melt(df, id="brand")

further reading on reshape

Welcome to the community @bluetail! Below is one way to transform your data using pivot_longer(), as well as a way to generate a line plot for the different variables (it looks a little funny because there are multiple measurements on the same day).

library(tidyverse)

out = df %>%
  pivot_longer(-'date', names_to = 'variable') %>%
  select(variable, value, date) %>%
  arrange(variable)

out
#> # A tibble: 12 × 3
#>    variable   value date      
#>    <chr>      <dbl> <date>    
#>  1 humid       93.8 2013-01-01
#>  2 humid       53.3 2013-01-01
#>  3 humid       50.3 2013-01-02
#>  4 humid       54.6 2013-01-02
#>  5 temp        60.8 2013-01-01
#>  6 temp        46.0 2013-01-01
#>  7 temp        27.0 2013-01-02
#>  8 temp        25.0 2013-01-02
#>  9 wind_speed  40.3 2013-01-01
#> 10 wind_speed  39.1 2013-01-01
#> 11 wind_speed  15.0 2013-01-02
#> 12 wind_speed  13.8 2013-01-02

# plot
ggplot(out, aes(x = date, y = value)) +
  geom_line(aes(color = variable))

image

1 Like

thank you very much! is there a way to pick only 'temp' and 'wind_speed', omitting 'humid' in this transformation?

You could add the following filter statement:

out = df %>%
  pivot_longer(-'date', names_to = 'variable') %>%
  select(variable, value, date) %>%
  arrange(variable) %>%
  filter(variable != 'humid')

This topic was automatically closed 7 days after the last reply. New replies are no longer allowed.

If you have a query related to it or one of the replies, start a new topic and refer back with a link.