Please I am having issues with the output of my plot. The graphs are not well aligned. I need help on it please!
tidy_text <- clean_data %>%
unnest_tokens(bigram, review, token="ngrams", n=2)
##SEPERATE WORDS
bigrams_separated <-tidy_text %>%
separate(bigram,c("word1","word2"),sep=" ")
####filter stop words and NA
bigrams_filtered <- bigrams_separated %>%
filter(!word1 %in% stop_words$word) %>%
filter(!word2 %in% stop_words$word) %>%
filter(!is.na(word1))%>%
filter(!is.na(word2))
####
#bigram united
bigrams_united <- bigrams_filtered%>%
unite(bigram, word1, word2, sep=" ")
#####
my_stopwords <-data.frame(word=c("air canada", "air hostess","fly air","ac 165leaving",
"ac 165scheduled", "seat not","and seat",
"not suitable","suitable for",
"for long","1abreast pitch","layout 1abreast",
"bag arrived","flight delays","delayed bags",
"canada staff","canada waiting","adult males",
"additional 1minutes","canada flight","airport air",
"aeroplane air", "chair assistance","aeroplan air",
"ac baggage", "2voucher issued","arrived speaking",
"bags arrived","cancelled times", "bed total",
"flight attendants","flight ac","flag carrier","elite million",
"delayed untill","ground crew","handle people's","pearson terminal",
"pearson airport","palm beach","million miler","mention specifically",
"national flag","cancelation hotel"))
airline <- bigrams_united %>% anti_join(my_stopwords, by=c("bigram"="word"))
####term frequency
bigram_tf_idf <- airline %>% count(verification,bigram)%>%
bind_tf_idf(bigram, verification, n) %>%
arrange(desc(tf_idf))
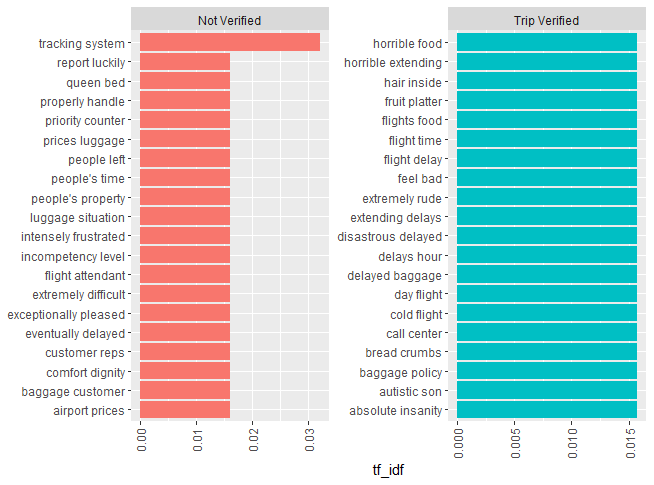
###bar plot of the term frequency
bigram_tf_idf %>%
group_by(verification)%>%
slice_head(n=20)%>%
ungroup() %>%
ggplot(aes(x=reorder(bigram, tf_idf),y=tf_idf, fill=verification))+
geom_col(show.legend=FALSE)+
labs(x=NULL, y="tf_idf") +
scale_x_reordered()+
coord_flip()+
facet_wrap(~verification, ncol=2, scales="free")+
theme(axis.text.x=element_text(angle=90, hjust=1, vjust=0.5))
This is the out put of my plot....