library(cluster)
library(factoextra)
#> Loading required package: ggplot2
#> Welcome! Want to learn more? See two factoextra-related books at https://goo.gl/ve3WBa
library(ggplot2)
x <- data.frame(
aaddr = c(
"800 Coddingtown Ctr", "900 Coddingtown Ctr",
"1363 N Mcdowell Blvd", "8270 Petaluma Hill Rd", "311 Rohnert Park Expy W",
"100 Santa Rosa Plz"
),
saledate = c("2005-11-21", "2005-11-21", "2017-04-13", "2015-04-03", "2022-06-24", "2015-07-06"),
psf = c(105, 105, 186, 10.8, 164, 180),
price = c(10562045, 7882123, 16416907, 1200000, 14000000, 12829406)
)
class(x)
#> [1] "data.frame"
# converting x to matrix will return an all
# character or all numeric matrix, while
# a data frame can mix those types
# ggplot expects a data frame object
# and pam can take either
# y=as.matrix(x)
# the data I have at hand is mixed,
# so remove non-numeric and rename
x <- x[3:4]
colnames(x) <- c("V1", "V2")
x
#> V1 V2
#> 1 105.0 10562045
#> 2 105.0 7882123
#> 3 186.0 16416907
#> 4 10.8 1200000
#> 5 164.0 14000000
#> 6 180.0 12829406
# the loop does not return anything
r <- for (i in 2:(nrow(x) - 1)) pam(x, k = i, metric = "euclidean")
r
#> NULL
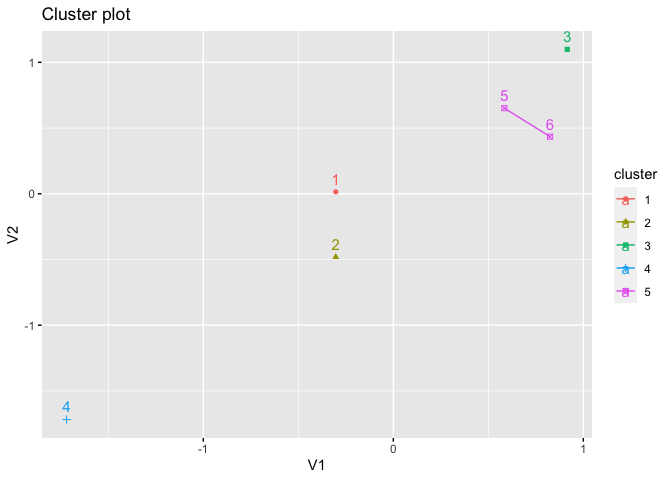
kmed <- pam(x, k = 5)
# call of the function uses deprecated parameter
fviz_cluster(kmed, star.plot = TRUE, frame.type = FALSE)
#> Warning: argument frame is deprecated; please use ellipse instead.
#> Warning: argument frame.type is deprecated; please use ellipse.type instead.
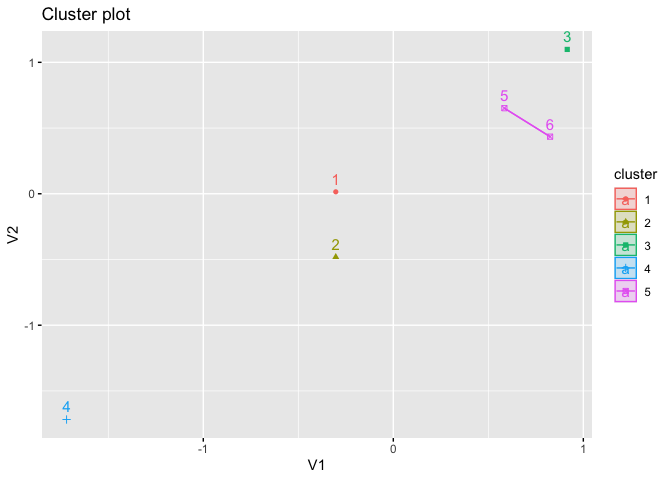
# the return value is a ggplot object, that displays
# but does not stay in namespace
fviz_cluster(kmed, star.plot = TRUE)
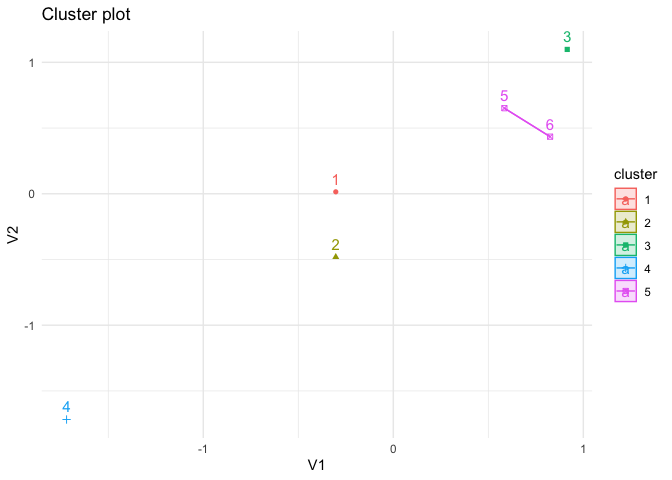
# instead, assign it a name; the conventional name
# for a ggplot object is p
p <- fviz_cluster(kmed, star.plot = TRUE)

# kmed has already been used to create a ggplot
# object, and from now on it can be embellished
# with simply the + operator
# ggplot(kmed)

p +
  theme_minimal()
Created on 2023-01-26 with reprex v2.0.2