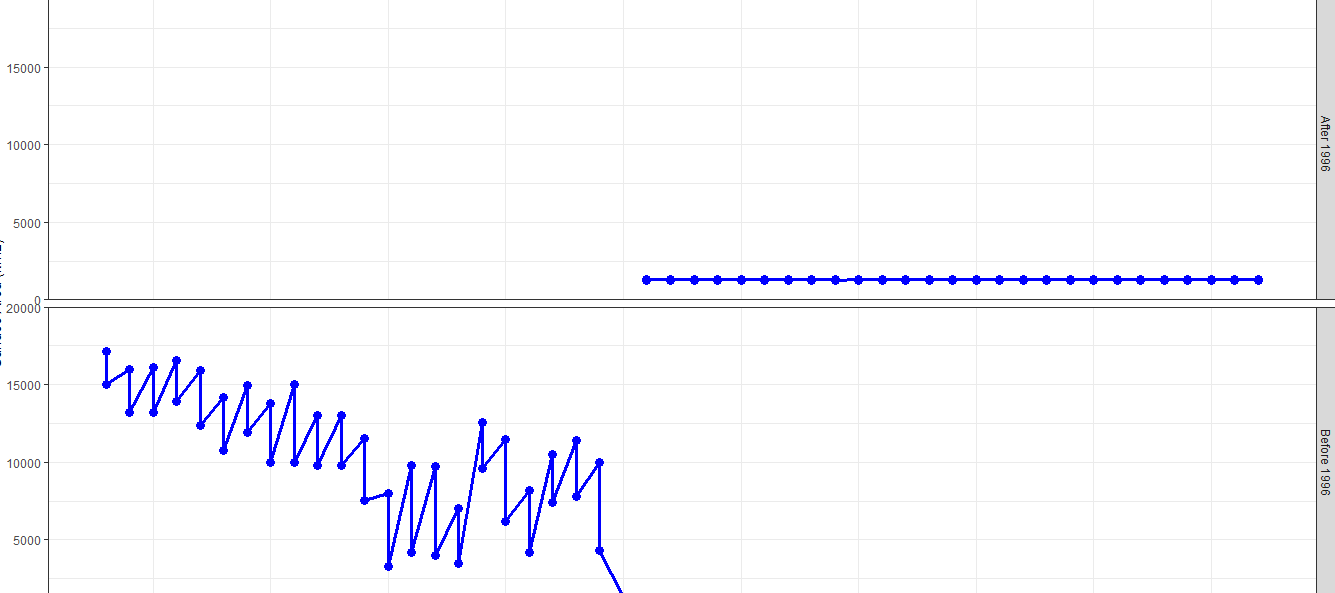
I have two data, before 1996, the trend was very high between 0-20000 but after 1996, all I had was very low between 0 -2000
Here is what I have gotten
I have two data, before 1996, the trend was very high between 0-20000 but after 1996, all I had was very low between 0 -2000
Here is what I have gotten
Please show the code that makes the plot.
This topic was automatically closed 21 days after the last reply. New replies are no longer allowed.
If you have a query related to it or one of the replies, start a new topic and refer back with a link.