I know it is a stupid problem but when I run this function for this graph, RStudio don't show me it. I use a Mac
data(mtcars)
str(mtcars)
m1=lm(mpg~hp+wt+am,data=mtcars);
summary(m1)
par(mfrow=c(1,2))
I know it is a stupid problem but when I run this function for this graph, RStudio don't show me it. I use a Mac
data(mtcars)
str(mtcars)
m1=lm(mpg~hp+wt+am,data=mtcars);
summary(m1)
par(mfrow=c(1,2))
No stupid questions, just stupid answers, you know?
par() is just set up—in this case the number of panes by rows and columns. plot() actually displays the data. Because the plot method for objects produced by lm has four by default (out of six), I've used 2,2
m1 <- lm(mpg ~ hp + wt + am,data=mtcars)
par(mfrow=c(2,2))
plot(m1)
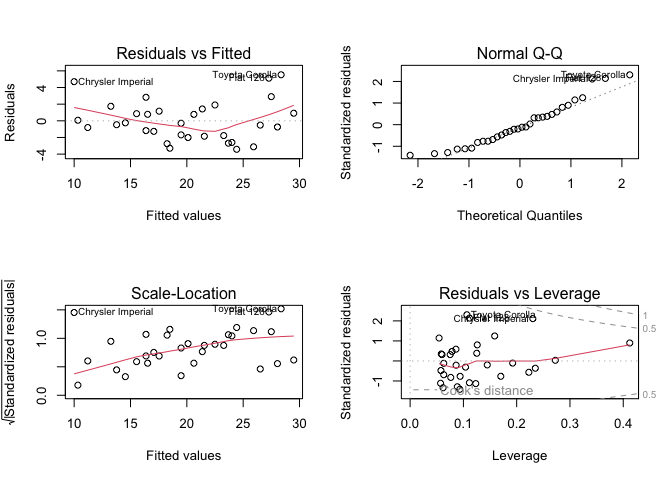
Created on 2023-05-01 with reprex v2.0.2
Using my snippet, confirm?
Of course. Now if I run the function twice, R shows me the graph. I don't know why
Just checking. Come back if it pops up again. I'll be notified.
This topic was automatically closed 21 days after the last reply. New replies are no longer allowed.
If you have a query related to it or one of the replies, start a new topic and refer back with a link.