If it is numeric or categorically

I have a datset called: fish_oil_18
link: https://cran.r-project.org/web/packages/openintro/openintro.pdf

I can't find out how many numeric or categorically variables it is. I know it is 2 observations and 48 variables. Also I wonder about the spread of numeric variables.

Which code is it here? I'm as you guys know a super noob at rstudio.

Try

str(fish_oil_18)

for a start.

I've tried it and got what the picture show. So to understand this correct, it is the numbers who is numeric here; like 386, 419, 12547, 12519 and so on. And not major_cardio_event, and no event, they are probably categorically variables, right?

Thanks!

The distinction between numeric and categorical may not be so clear. Everything in the picture is a number. You need to know what the numbers mean. If a number is a count, for example, then it is typically not categorical. If a number is a code for some event, then it likely is categorical.

Hi @Stenmark you can run this code for get the type, numeric or character of columns in a data frame.

# Im use iris data

contar_tipos_columna <- function(df) {
  tipos <- sapply(df, is.numeric)
  tipos_caracter <- ifelse(tipos, "numeric", "character")
  return(tipos_caracter)
}

data(iris)
tipos_columna <- contar_tipos_columna(iris)
tipos_columna

# Sepal.Length  Sepal.Width Petal.Length  Petal.Width      Species 
# "numeric"    "numeric"    "numeric"    "numeric"     "character"

# ---

# For get the numbers of value different to NA in each column:
colSums(!is.na(iris))
# Sepal.Length  Sepal.Width Petal.Length  Petal.Width      Species 
#       150          150          150          150          150 

Thank you so much guys! It helped a lot.

Hi again!

I have another question. My group know what I asked about last question, but now we wan't to make this kind of histogram(?)/figure. Because our dataset fish_oil_18 is similar to this one (picture). We have responses and frequency to fishoil and placebo.

How do we make this kind of figure (who is in red and blue)?

something along these lines

library(tidyverse)

(example_data <- expand_grid(
  exp = c("L", "H"),
  resp = c("Y", "N")
) |> mutate(frq = 1:4))


# turn to percentage by the x
(example_data_2 <- group_by(
  example_data,
  resp
) |>
  mutate(
    pcnt = frq / sum(frq)
  ))

ggplot(data=example_data_2,
       aes(x=resp,
           y=pcnt,
           fill=exp)) +
  geom_col(width=.99) +
  scale_fill_manual(values=c(
    "L"="lightblue",
    "H"="maroon"
  )) + 
  theme_minimal() +
  theme(panel.grid = element_blank(),
        axis.title.y = element_blank(),
        axis.text.y=element_blank(),
        legend.position = "none",
        plot.margin = unit(c(1, 1, 1, 2), "cm")) +
  coord_cartesian(clip="off") + 
  annotate("text",
           x = .2,
           y = .66, label = "High")+
  annotate("text",
           x = .2,
           y = .33, label = "Low")

1 Like

How to add percentages and counts labels to this plot ?

You can use geom_text or geom_label

Your data set is not a data.frame or tibble

class(fish_oil_18)
[1] "list"

Thanks. It helped a lot. But now I'm soon finish with one plot, but I do get one error; ",".
It is the " , " after [1:4])),

Do you guys how I can fix it?

It's easier to be helpful if you copy and paste your code here rather than posting a picture.

From the little that I can see, it looks like you are piping a ggplot into mutate, which is probably not what you intend (although the picture doesn't show all details so I may be wrong.)

p + geom_text(data = layer_data(p, 1) %>% select(xmin:ymax) %>% mutate(m.x = (xmin + xmax))/2, m.y = (ymin + ymax)/2) %>% select(m.x, m.y) %>% mutate(string = c(letters[1:4])), aes(x = m.x, y = m.y, label = string)

Ok. This is the code, the last code. Everything goes like this:

library(ggmosaic)
install.packages("reprex")
library(reprex)

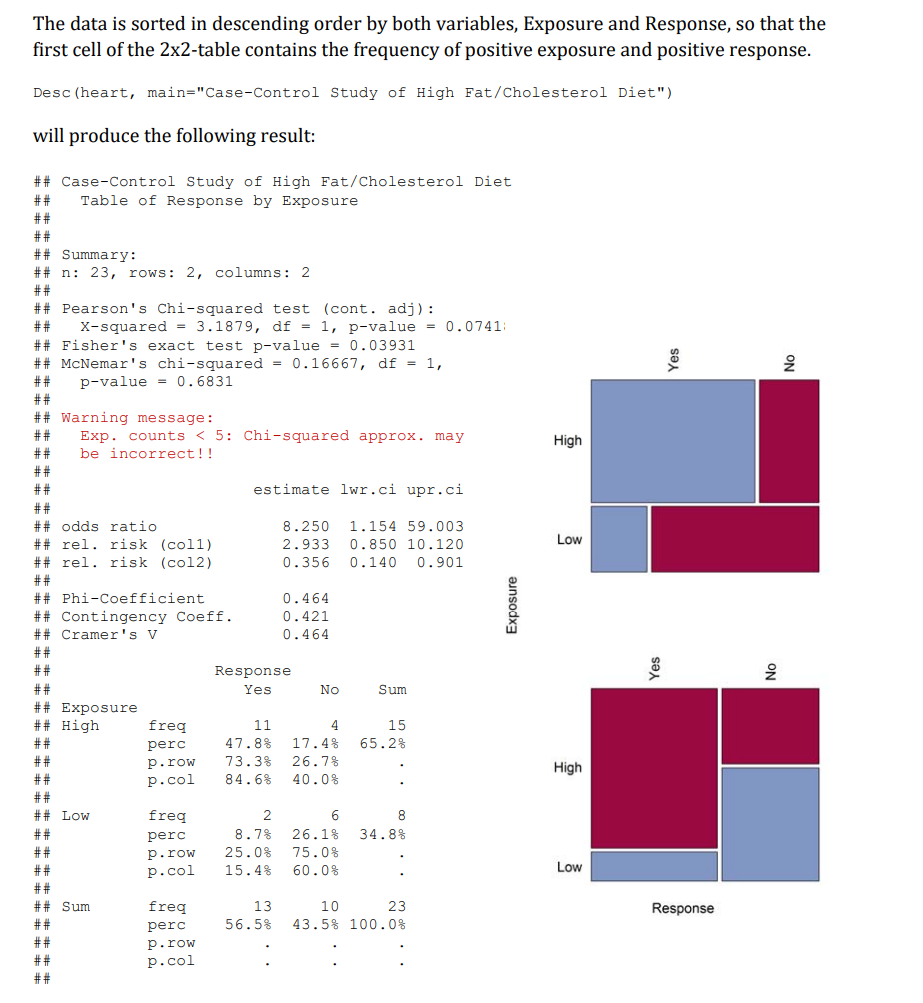
infarct2 <- as.table(matrix(c(145, 200, 12788, 12738), 2,2))

dimnames(infarct2) <- list(Exposure = c("Fiskeolje", "Ikke"), Response = c("Ja", "Nei"))

percentages <- round(100*prop.table(infarct2), 2)

etiquettes <- as.table(matrix(paste0(infarct2, ";", percentages, "%"), 2, 2))

dimnames(etiquettes) <- dimnames(infarct2)

to_plot <- as.data.frame(etiquettes)

ggplot(data = to_plot) + geom_mosaic(aes(x = product(Response,Exposure), fill=Freq), na.rm = TRUE) + labs(x = "Response", y = "Exposure")

p <- ggplot(infarct2 %>% as_tibble()) + geom_mosaic(aes(weight = n, x = product(Response), fill = Exposure))

p + geom_text(data = layer_data(p, 1) %>% select(xmin:ymax) %>% mutate(m.x = (xmin + xmax))/2, m.y = (ymin + ymax)/2) %>% select(m.x, m.y) %>% mutate(string = c(letters[1:4])), aes(x = m.x, y = m.y, label = string)

I think--but I'm not sure-- that the problem is the closing parenthesis after xmax unintentionally closes the mutate().

Maybe I'm really stupid. I now tried to make space, delete a parenthesis and so on... but nothing worked.

The error keep saying the same thing:

Error: unexpected ',' in "p + geom_text(data = layer_data(p, 1) %>% select(xmin:ymax) %>% mutate(m.x = (xmin + xmax))/2, m.y = (ymin + ymax)/2) %>% select(m.x, m.y) %>% mutate(string = c(letters[1:4])),"

I recommend improving the styling/layout of your code.
This means choosing points to add a line break so that some code is written to the next line.
compare this equivalent code

ggplot(economics_long, aes(date, value01, colour = variable)) + geom_line()+ theme(legend.position = "top")
ggplot(
  data = economics_long,
  aes(date,
    value01,
    colour = variable
  )) +
  geom_line() + 
  theme(legend.position = "top")

when you write code involving strings; you have to take care to balance them every " that you start will need a companion " that ends it ; similarly single quotes ' , also brackets.
If you struggle to see where you lose these balanced pairs of token, make yourself a fresh script, and grow your code part by part till you identify where it breaks.

For larger work, there is a significant benefit to using version control software like git to manage your versions, you can keep a history of working code; when you add code that breaks , you can both a) go back to the previous working code, b) more easily see the change from your prior working code to your code now. Though for a simple short script this is overkill, for any significant or long lasting project work, it becomes necessary.

Finally; when sharing code to this forum its vital to format it to appear as code

This topic was automatically closed 42 days after the last reply. New replies are no longer allowed.

If you have a query related to it or one of the replies, start a new topic and refer back with a link.