In a figure in ggplot, how can I make the error bars of my two groups point to different directions so they don't overlap?

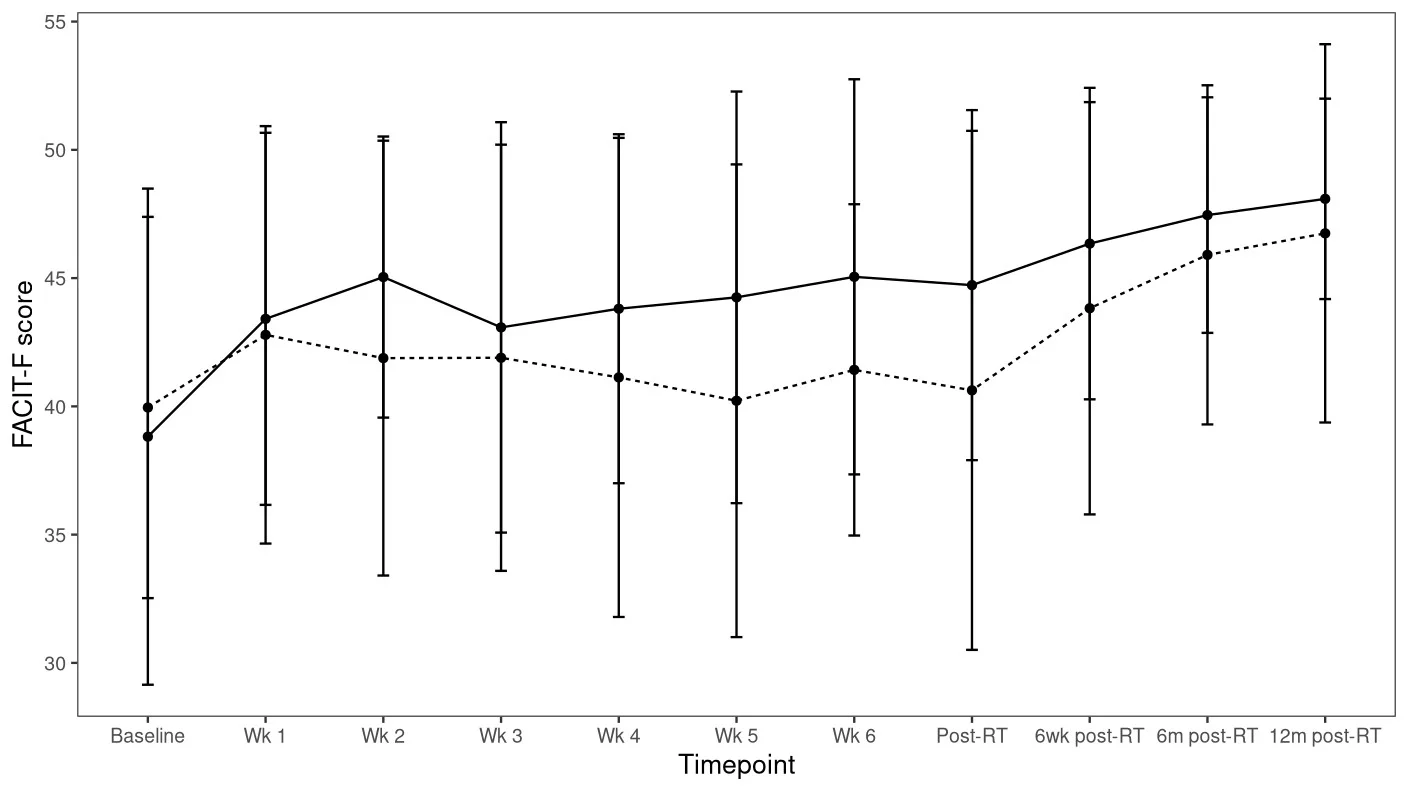
Hi, I have the below figure.

The code that produces this is:

linegraphFACITF_ALL <- ggplot(data=pergroupFACITF_ALL, aes(x=Timepoint, y=mean, group=Group)) +
    geom_line(aes(linetype=Group)) +
    geom_point() + geom_errorbar(aes(ymin=mean-sd, ymax=mean+sd), width=.1) +
 labs(y = expression("FACIT-F score"), x="Timepoint") + theme_apa(legend.pos = "none")

I got two groups ('Exercise' and 'Usual Care' in the variable 'Group'). How can I make the error bars of the group that has the straight line be only above their points, and the error bars of the group with the dashed line be only below their points? I don't want to use position=dodge, as it still makes the figure cluttered.

Below is the dataframe 'pergroupFACITF_ALL' in csv format

Group,Timepoint,count,mean,sd
Exercise,Baseline,38,38.819047619047616,9.670500543696773
Exercise,Wk 1,38,43.41203703703704,7.251763453963447
Exercise,Wk 2,38,45.04054054054054,5.477705291018791
Exercise,Wk 3,38,43.078828828828826,7.9990341321341445
Exercise,Wk 4,38,43.806306306306304,6.8020414411974714
Exercise,Wk 5,38,44.25,8.023254038355303
Exercise,Wk 6,38,45.05,7.701503612590002
Exercise,Post-RT,38,44.726124885215796,6.822812537639399
Exercise,6wk post-RT,38,46.345588235294116,6.071547748946408
Exercise,6m post-RT,38,47.457142857142856,4.5911862951353495
Exercise,12m post-RT,38,48.08888888888889,3.906581070626291
Usual Care,Baseline,42,39.95614035087719,7.430754836032656
Usual Care,Wk 1,42,42.78846153846154,8.136105683894794
Usual Care,Wk 2,42,41.88095238095238,8.47489803076258
Usual Care,Wk 3,42,41.89484126984127,8.307297937697957
Usual Care,Wk 4,42,41.12916666666667,9.337948149407644
Usual Care,Wk 5,42,40.21875,9.213364679077749
Usual Care,Wk 6,42,41.42261904761905,6.456996494040687
Usual Care,Post-RT,42,40.625,10.116469182375278
Usual Care,6wk post-RT,42,43.824786324786324,8.035461310748326
Usual Care,6m post-RT,42,45.90625,6.610643299914894
Usual Care,12m post-RT,42,46.744360902255636,7.3735106797643954

Hello.
Thanks for providing code , but you could take further steps to make it more convenient for other forum users to help you.

Share some representative data that will enable your code to run and show the problematic behaviour.

You might use tools such as the library datapasta, or the base function dput() to share a portion of data in code form, i.e. that can be copied from forum and pasted to R session.

Reprex Guide

Thanks, I've added the data in csv format.

It may be that someone will take the time to help you from that.
But it would surely be easier for you to provide the example data in a forum friendly way ( as I wrote in my message, and as I linked you to) than it would be for others to use your forum unfriendly format

Is this what you're after?

library(tidyverse, warn.conflicts = F)

dat <- read_csv(
  "Group,Timepoint,count,mean,sd
Exercise,Baseline,38,38.819047619047616,9.670500543696773
Exercise,Wk 1,38,43.41203703703704,7.251763453963447
Exercise,Wk 2,38,45.04054054054054,5.477705291018791
Exercise,Wk 3,38,43.078828828828826,7.9990341321341445
Exercise,Wk 4,38,43.806306306306304,6.8020414411974714
Exercise,Wk 5,38,44.25,8.023254038355303
Exercise,Wk 6,38,45.05,7.701503612590002
Exercise,Post-RT,38,44.726124885215796,6.822812537639399
Exercise,6wk post-RT,38,46.345588235294116,6.071547748946408
Exercise,6m post-RT,38,47.457142857142856,4.5911862951353495
Exercise,12m post-RT,38,48.08888888888889,3.906581070626291
Usual Care,Baseline,42,39.95614035087719,7.430754836032656
Usual Care,Wk 1,42,42.78846153846154,8.136105683894794
Usual Care,Wk 2,42,41.88095238095238,8.47489803076258
Usual Care,Wk 3,42,41.89484126984127,8.307297937697957
Usual Care,Wk 4,42,41.12916666666667,9.337948149407644
Usual Care,Wk 5,42,40.21875,9.213364679077749
Usual Care,Wk 6,42,41.42261904761905,6.456996494040687
Usual Care,Post-RT,42,40.625,10.116469182375278
Usual Care,6wk post-RT,42,43.824786324786324,8.035461310748326
Usual Care,6m post-RT,42,45.90625,6.610643299914894
Usual Care,12m post-RT,42,46.744360902255636,7.3735106797643954"
)
#> Rows: 22 Columns: 5
#> ── Column specification ────────────────────────────────────────────────────────
#> Delimiter: ","
#> chr (2): Group, Timepoint
#> dbl (3): count, mean, sd
#> 
#> ℹ Use `spec()` to retrieve the full column specification for this data.
#> ℹ Specify the column types or set `show_col_types = FALSE` to quiet this message.

ggplot(dat, aes(x = Timepoint, y = mean, group = Group)) +
  geom_line(aes(linetype = Group)) +
  geom_point() +
  geom_errorbar(
    data = filter(dat, Group == "Exercise"),
    aes(ymin = mean, ymax = mean + sd),
    width = .1
  ) +
  geom_errorbar(
    data = filter(dat, Group != "Exercise"),
    aes(ymin = mean - sd, ymax = mean),
    width = .1
  ) +
  labs(y = expression("FACIT-F score"), x = "Timepoint") +
  theme_bw() +
  theme(legend.position = "none")

Created on 2022-08-10 by the reprex package (v2.0.1)

2 Likes

Thank you very much!!

This topic was automatically closed 7 days after the last reply. New replies are no longer allowed.

If you have a query related to it or one of the replies, start a new topic and refer back with a link.