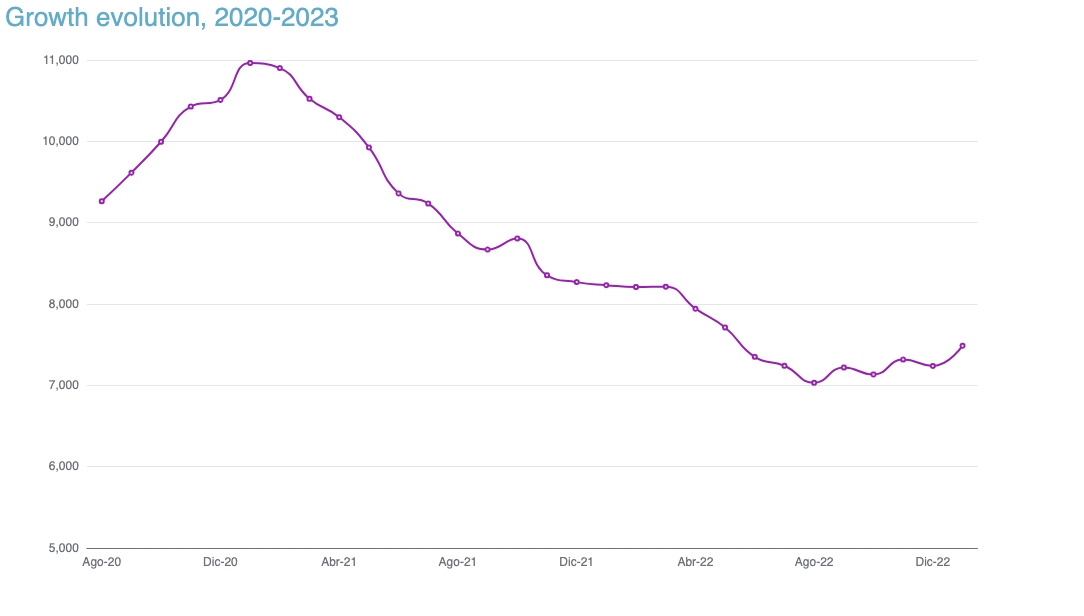
I'm doing a graphic with echarts4r. This is the structure:
structure(list(Mes = c("Ago-20", "Sep-20", "Oct-20", "Nov-20",
"Dic-20", "Ene-21", "Feb-21", "Mar-21", "Abr-21", "May-21", "Jun-21",
"Jul-21", "Ago-21", "Sep-21", "Oct-21", "Nov-21", "Dic-21", "Ene-22",
"Feb-22", "Mar-22", "Abr-22", "May-22", "Jun-22", "Jul-22", "Ago-22",
"Sep-22", "Oct-22", "Nov-22", "Dic-22", "Ene-23"), Parados = c(9263,
9615, 9995, 10427, 10509, 10963, 10901, 10524, 10297, 9925, 9360,
9235, 8866, 8669, 8805, 8353, 8269, 8232, 8209, 8213, 7943, 7711,
7350, 7241, 7032, 7219, 7134, 7317, 7239, 7488)), class = c("tbl_df",
"tbl", "data.frame"), row.names = c(NA, -30L))
And this my code:
paro %>% e_charts(x = Mes) %>%
        e_line(serie = Parados, smooth = T) %>%
        e_tooltip(trigger = "axis", backgroundColor = "white") %>%
        e_legend(show = FALSE) %>%
        e_title(text = "Growth evolution, 2020-2023",
                textStyle = list(fontSize = 26), itemGap = 8, subtextStyle = list(fontSize = 18)) %>%
        e_theme("cool")  %>%
        e_grid(left = '8%') %>%
        e_x_axis(show = T, axisLabel = list(interval = 3, rotate = 0), axisTick = (show = FALSE)) %>%
        e_y_axis(locale = NULL, show = T, min = 5000)
I want to increase the space between the graphic and the title, but I can't imagine how to do it.