Is this close to what you want?
df <- tibble::tribble(
    ~Product.Code, ~Product.Name, ~Price,
    "AA22",       "blah1",   2.12,
    "AA22",       "blah1",   2.42,
    "AA22",       "blah1",      4,
    "BB33",       "blah2",   5.54,
    "BB33",       "blah2",   3.42,
    "BB33",       "blah2",   4.34,
    "CC23",       "blah3", 100.23,
    "CC23",       "blah3",  25.23,
    "CC23",       "blah3", 105.25
)

library(ggplot2)

ggplot(df, aes(x = "", y = Price, fill = Product.Code)) +
    geom_boxplot() +
    geom_point(position = 'jitter') +
    facet_grid(vars(Product.Code)) +
    coord_flip() +
    labs(x = "")
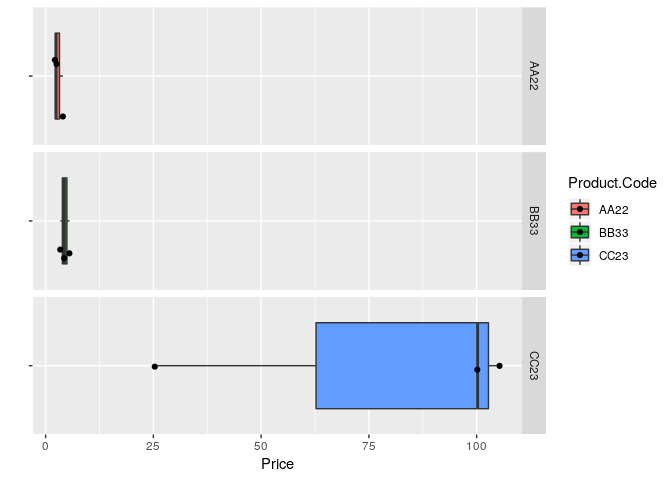
Created on 2019-02-06 by the reprex package (v0.2.1)
We could give you better help if you provide a reproducible example, A reprex makes it much easier for others to understand your issue and figure out how to help.