Hi Hope it helps,
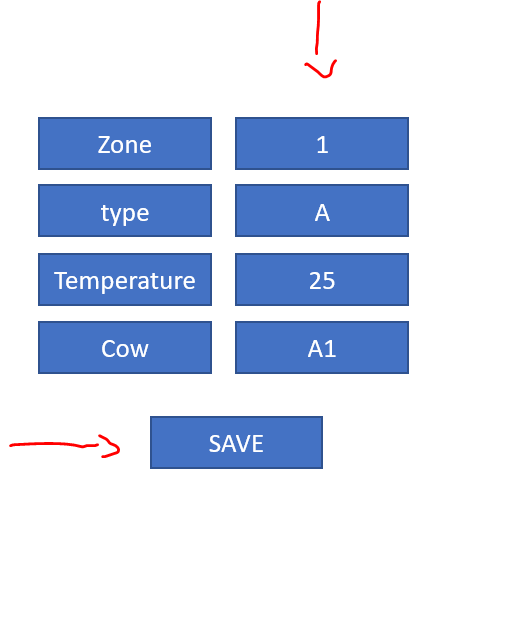
you can enter data and save it in a data frame. You have option to download the data frame as csv. **Please note, the first row will appear in the table , when you add the second, **
library(shiny)
library(shinydashboard)
library(dplyr)
library(DT)
library(shinyjs)

ui <- fluidPage(
  align='center',
  textAreaInput(inputId = 'mValueEntered',
                label = 'Enter values just with comma',
                value = "1,A,25,A1"),

  actionButton(inputId = 'mSaveBtn',label = 'Save'),
  DT::dataTableOutput(outputId = 'mShowTbl',width = '500px'),
  downloadButton("downloadCSVBtn", "Download Dataset CSV")

)


server <- function(input, output, session) {
  rv <- reactiveValues(df=NULL)

  df <- list()

  observeEvent(input$mSaveBtn,{
    if (is.data.frame(df)==FALSE){
      df <- data.frame(Zone=integer(),
                       type = character(),
                       Temperature= double(),
                       Cow = character())
    }

    cc<- as.list(scan(text = input$mValueEntered, what = "", sep = ","))
    cc<-data.frame(mData=unlist(cc))

    df<<- df %>% add_row(
      Zone=as.numeric(cc[1,1]),
      type = cc[2,1],
      Temperature= as.numeric(cc[3,1]),
      Cow = cc[4,1])


    rv$df <- df

  })


  output$mShowTbl <- DT::renderDataTable({
    DT::datatable(rv$df,
                  rownames = FALSE,
                  width = NULL,
                  height = NULL,
                  editable = TRUE,
                  selection = list(mode = "single", selected = c(1), target = 'row'),
                  options = list(
                    scrollY = '325px',
                    class="compact",
                    paging = FALSE,
                    searching = FALSE,
                    ordering = FALSE,
                    initComplete = JS(
                      "function(settings, json) {",
                      "$(this.api().table().header()).css({'background-color': 'steelblue', 'color': '#fff'});",
                      "}")
                  )
    )
  })

  ##########################################################################
  # Code to download dataset as csv and rds
  ##########################################################################
  output$downloadCSVBtn<- downloadHandler(
    filename = function() {
      paste("mydata", Sys.Date(), ".csv", sep="")
    },
    content = function(file) {
      write.csv(data.frame(rv$df), file, row.names = FALSE)
    }
  )


}

shinyApp(ui, server)