interaction.plot output is an empty plot

Hello!
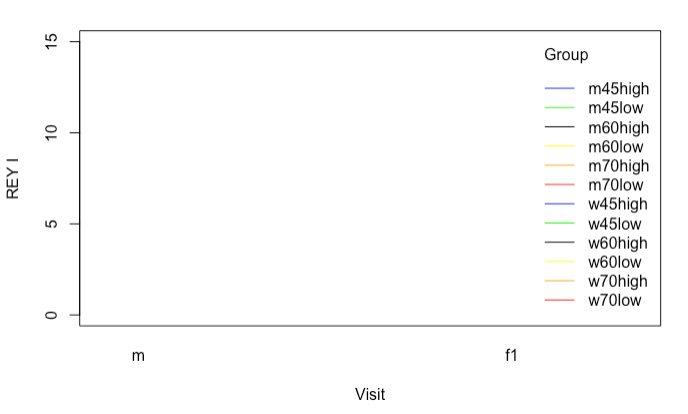
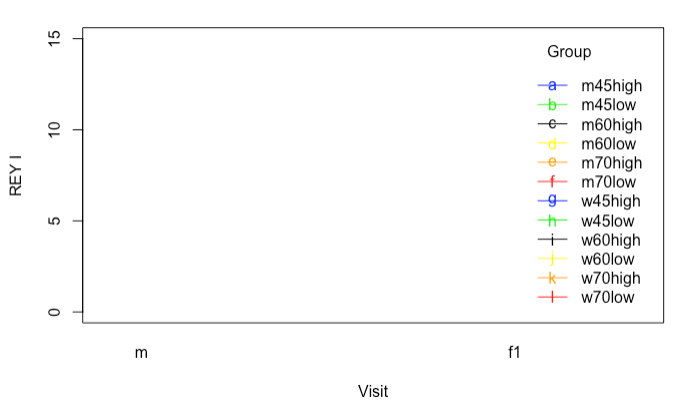
I'm trying to create an interaction plot using the interaction.plot function from the stats package. However, the output I get is an empty plot... Does anyone know what I'm doing wrong here? My dataframe is in the "long" format (longitudinal data with two time points). The variables "visit" and "group" are factors, while "COG_REYI_SCORE" is numeric. Thanks!

interaction.plot(x.factor = d_long$visit,
trace.factor = d_long$group,
response = d_long$COG_REYI_SCORE,
fun = mean,
type = c("l"),
legend = TRUE,
trace.label = "Group",
fixed = FALSE,
xlab = "Visit",
ylab = "REY I",
ylim = range(0, 15, na.rm = TRUE),
lty = 1,
col = c("blue", "green", "black","yellow", "orange", "red"),
pch = c(1:9, 0, letters),
#xpd = NULL, leg.bg = par("bg"), leg.bty = "n",
#xtick = FALSE, xaxt = par("xaxt"), axes = TRUE,
)

Capture d’écran, le 2022-09-07 à 09.10.58

Hi @jlegault ,
Looks like the plotting symbol definition is wrong. Try using

pch=letters[1:12]

plus get the parentheses matched correctly.

Hi @DavoWW,

Thank you for your reply.

I replaced "pch = c(1:9, 0, letters)," by "pch=letters[1:12]", but I get the same output (an empty plot). I also checked the parentheses but they seemed to be matched correctly...

Hi @jlegault,
I fixed your code (using dummy data) like this:

# create some dummy data
d_long <- data.frame(visit = rep(1:6, each=12),
                     group = rep(1:3, each=4, times=6),
                     COG_REYI_SCORE = rnorm(72, 5, 2))


interaction.plot(x.factor = d_long$visit,
  trace.factor = d_long$group,
  response = d_long$COG_REYI_SCORE,
  fun = mean,
  type = c("b"),  # Change here to plot "both" points and lines
  legend = TRUE,
  trace.label = "Group",
  fixed = FALSE,
  xlab = "Visit",
  ylab = "REY I",
  ylim = range(0, 15, na.rm = TRUE),
  lty = 1,
  col = c("blue", "green", "black","yellow", "orange", "red"),
  pch = c(letters[1:3])
  #pch = c(1:9, 0, letters))
  #xpd = NULL, leg.bg = par("bg"), leg.bty = "n",
  #xtick = FALSE, xaxt = par("xaxt"), axes = TRUE,
)

Created on 2022-09-10 with reprex v2.0.2

Hope this helps.

1 Like

Hi @DavoWW,

Thank you so much for coming back. I was able to run the code on your dummy data and get the same output, but I can't seem to make it run on my dataframe. Since I have 12 groups instead of 3, I changed "pch = c(letters[1:3])" to "pch = c(letters[1:12])", but I still get an empty plot.

The problem seems to be in my dataframe rather than in the code. Any idea what I should be verifying in my dataframe?

Capture d’écran, le 2022-09-12 à 11.45.53

Hi @jlegault,
Did you also change the type = c("b")?
Are your y values >15 or < 0 because you have set the y-axis limit = 0:15?

If you did, then the only way to solve this is for you to make your data available for us to try.
See the "posting guide" on how to do this.

Hello @DavoWW,

I did change the type = c("b"), and yes all my y values are between 0 and 15.

I tried something else: Instead of using my dataframe, I extracted the means and created a new dataframe:

par(mfrow=c(2,3))
fr1 <- data.frame(fact1 = c("Baseline", "Follow-up", "Baseline", "Follow-up","Baseline", "Follow-up", "Baseline", "Follow-up","Baseline", "Follow-up", "Baseline", "Follow-up"),
fact2 = c("M45 high", "M45 high", "M45 low", "M45 low","M60 high", "M60 high", "M60 low", "M60 low", "M70 high", "M70 high", "M70 low", "M70 low"),
val = c(4.080189, 4.719481, 4.307140, 5.019589, 3.599022, 4.016349, 3.600058, 4.072620, 2.500000, 2.595506, 2.675504, 2.805787))

I was then able to create the plot:

interaction.plot(fr1$fact1, fr1$fact2, fr1$val,
fun = mean,
type = "b",
legend = TRUE,
trace.label = "Group",
xlab = "Visit",
ylab = "REYI Score",
ylim = range(0, 15, na.rm = TRUE),
lty = 1,
col = c("darkolivegreen", "darkolivegreen3", "deepskyblue4", "deepskyblue", "red4", "red"),
leg.bty = "n",
pch = c(11, 12, 13))

Capture d’écran, le 2022-09-13 à 15.03.02

I suspect the problem has to do with the "visit" variable. The plot should illustrate two means per group, (one at baseline and one at follow-up), but I'm not sure my code/dataframe is appropriate to get that output.

Thank you again for your kind help!

This topic was automatically closed 42 days after the last reply. New replies are no longer allowed.

If you have a query related to it or one of the replies, start a new topic and refer back with a link.