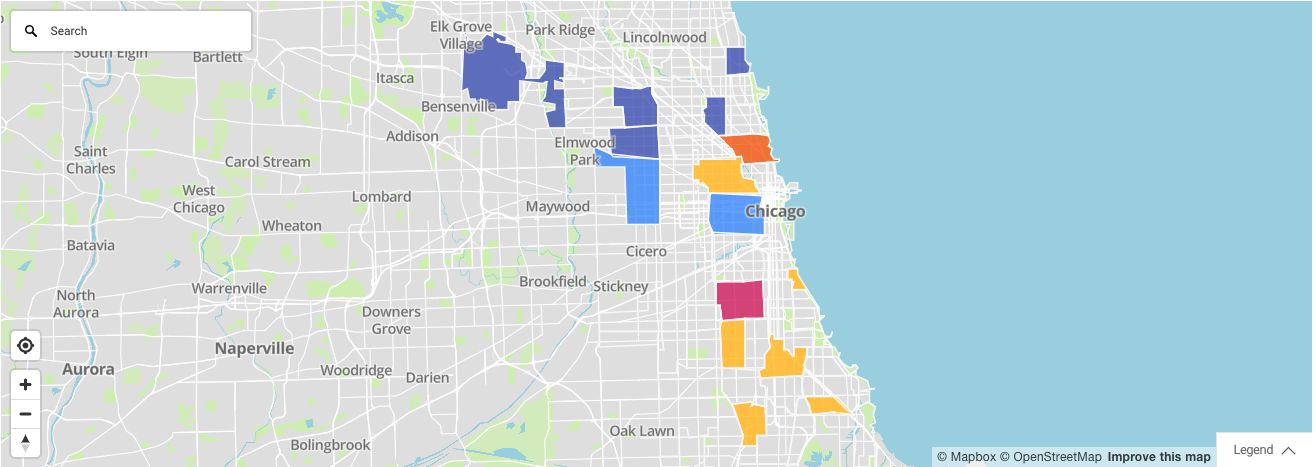
I'm trying to fill specific areas on a map in different colors like the attached sample picture based on cardinal points data, which are North, East, South, and West.
[sample pic]
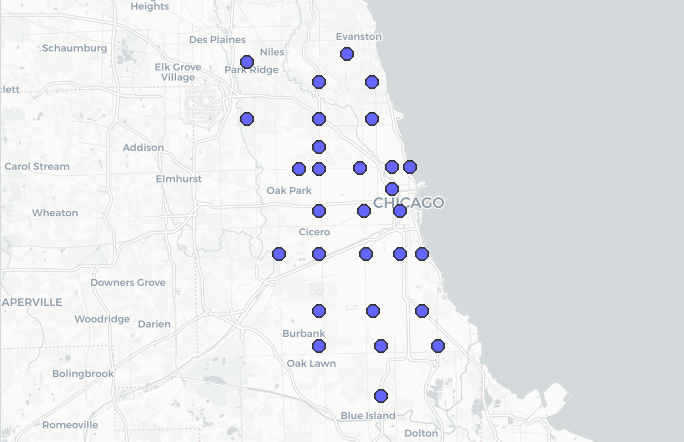
I executed this code but it created the points of areas on the map because I could assign only "WEST" and "NORTH" data.
> st_as_sf(chi_traffic_df, coords = c("WEST", "NORTH"), crs = 4326) %>%
    mapview()
[result pic]
Now, I'm trying to ask, are there any ways to fill in specific areas on the map like the sample picture attached above? It does not have to be exactly the same as that. Any kind of solution would be really appreciated.
The following is for your information.
- All packages I installed.
> search()
 [1] ".GlobalEnv"        "package:mapview"   "package:sf"        "package:lubridate" "package:forcats"   "package:stringr"   "package:dplyr"     "package:purrr"
 [9] "package:tidyr"     "package:tibble"    "package:ggplot2"   "package:tidyverse" "package:readr"     "tools:rstudio"     "package:stats"     "package:graphics"
[17] "package:grDevices" "package:utils"     "package:datasets"  "package:methods"   "Autoloads"         "org:r-lib"         "package:base"
- A small component of the data frame that I'm using for the visualization.
> glimpse(chi_traffic_df)
Rows: 6,193,381
Columns: 18
$ TIME          <chr> "03/31/2018 02:40:28 pm", "03/31/2018 02:40:28 pm", "03/31/2018 02:40:28 pm", "03/31/2018 02:40:28 pm", "03/31/2018 02:40:28 pm", "03/3…
$ REGION_ID     <int> 2, 3, 4, 6, 7, 8, 9, 10, 11, 12, 13, 14, 15, 17, 18, 19, 21, 22, 23, 24, 25, 26, 27, 28, 29, 1, 7, 29, 29, 29, 2, 7, 29, 22, 10, 14, 3,…
$ SPEED         <dbl> 27.95, 19.09, 18.41, 20.45, 18.41, 17.73, 23.73, 20.45, 18.41, 15.00, 15.68, 22.50, 22.50, 31.57, 23.18, 25.23, 21.14, 27.95, 21.82, 24…
$ REGION        <chr> "Far North West", "North Park-Albany-Linconl Sq", "Edge Water-Uptown", "Irving Park-Avondale-North Ctr", "Hermosa-Logan Square", "Linco…
$ BUS_COUNT     <int> 25, 48, 36, 48, 47, 82, 22, 46, 54, 50, 80, 47, 33, 7, 46, 46, 48, 28, 47, 38, 17, 45, 19, 6, 36, 21, 14, 82, 18, 19, 37, 38, 23, 25, 7…
$ NUM_READS     <int> 493, 834, 585, 811, 817, 1421, 363, 819, 864, 685, 1248, 819, 476, 88, 703, 881, 800, 377, 802, 679, 285, 894, 315, 143, 261, 380, 231,…
$ HOUR          <int> 14, 14, 14, 14, 14, 14, 14, 14, 14, 14, 14, 14, 14, 14, 14, 14, 14, 14, 14, 14, 14, 14, 14, 14, 14, 20, 0, 9, 5, 6, 20, 20, 20, 20, 20,…
$ DAY_OF_WEEK   <int> 7, 7, 7, 7, 7, 7, 7, 7, 7, 7, 7, 7, 7, 7, 7, 7, 7, 7, 7, 7, 7, 7, 7, 7, 7, 7, 5, 3, 4, 5, 5, 5, 5, 5, 5, 5, 5, 5, 5, 5, 5, 5, 5, 5, 5, …
$ MONTH         <int> 3, 3, 3, 3, 3, 3, 3, 3, 3, 3, 3, 3, 3, 3, 3, 3, 3, 3, 3, 3, 3, 3, 3, 3, 3, 8, 4, 3, 3, 3, 3, 3, 3, 3, 3, 3, 3, 3, 3, 3, 3, 3, 3, 3, 3, …
$ DESCRIPTION   <chr> "North of Montrose. East River to Cicero", "Montrose to Devon. Cicero to Ravenswood", "Montrose to Devon. Ravenswood to Lake Shore", "D…
$ RECORD_ID     <chr> "02-201803311940", "03-201803311940", "04-201803311940", "06-201803311940", "07-201803311940", "08-201803311940", "09-201803311940", "1…
$ WEST          <dbl> -87.84621, -87.74746, -87.67459, -87.74746, -87.74746, -87.67459, -87.77595, -87.74746, -87.69162, -87.64721, -87.64721, -87.74746, -87…
$ EAST          <dbl> -87.74746, -87.67459, -87.64644, -87.67459, -87.67459, -87.61911, -87.74746, -87.69162, -87.64721, -87.62308, -87.62308, -87.68537, -87…
$ SOUTH         <dbl> 41.96067, 41.96067, 41.96067, 41.93184, 41.90927, 41.91056, 41.86613, 41.86613, 41.86613, 41.88886, 41.86613, 41.82279, 41.82279, 41.76…
$ NORTH         <dbl> 42.01910, 41.99795, 41.99795, 41.96067, 41.93184, 41.96067, 41.90927, 41.90927, 41.91056, 41.91140, 41.88886, 41.86613, 41.86613, 41.82…
$ NW_LOCATION   <chr> "POINT (-87.84621 42.0190998)", "POINT (-87.747456 41.997946)", "POINT (-87.67459 41.997946)", "POINT (-87.747456 41.960669)", "POINT (…
$ SE_LOCATION   <chr> "POINT (-87.747456 41.960669)", "POINT (-87.67459 41.960669)", "POINT (-87.646438 41.960669)", "POINT (-87.67459 41.931841)", "POINT (-…
$ timeFormatted <dttm> 2018-03-31 14:40:28, 2018-03-31 14:40:28, 2018-03-31 14:40:28, 2018-03-31 14:40:28, 2018-03-31 14:40:28, 2018-03-31 14:40:28, 2018-03-…
- You can check the details of the data frame if it's necessary.