Hi friends,
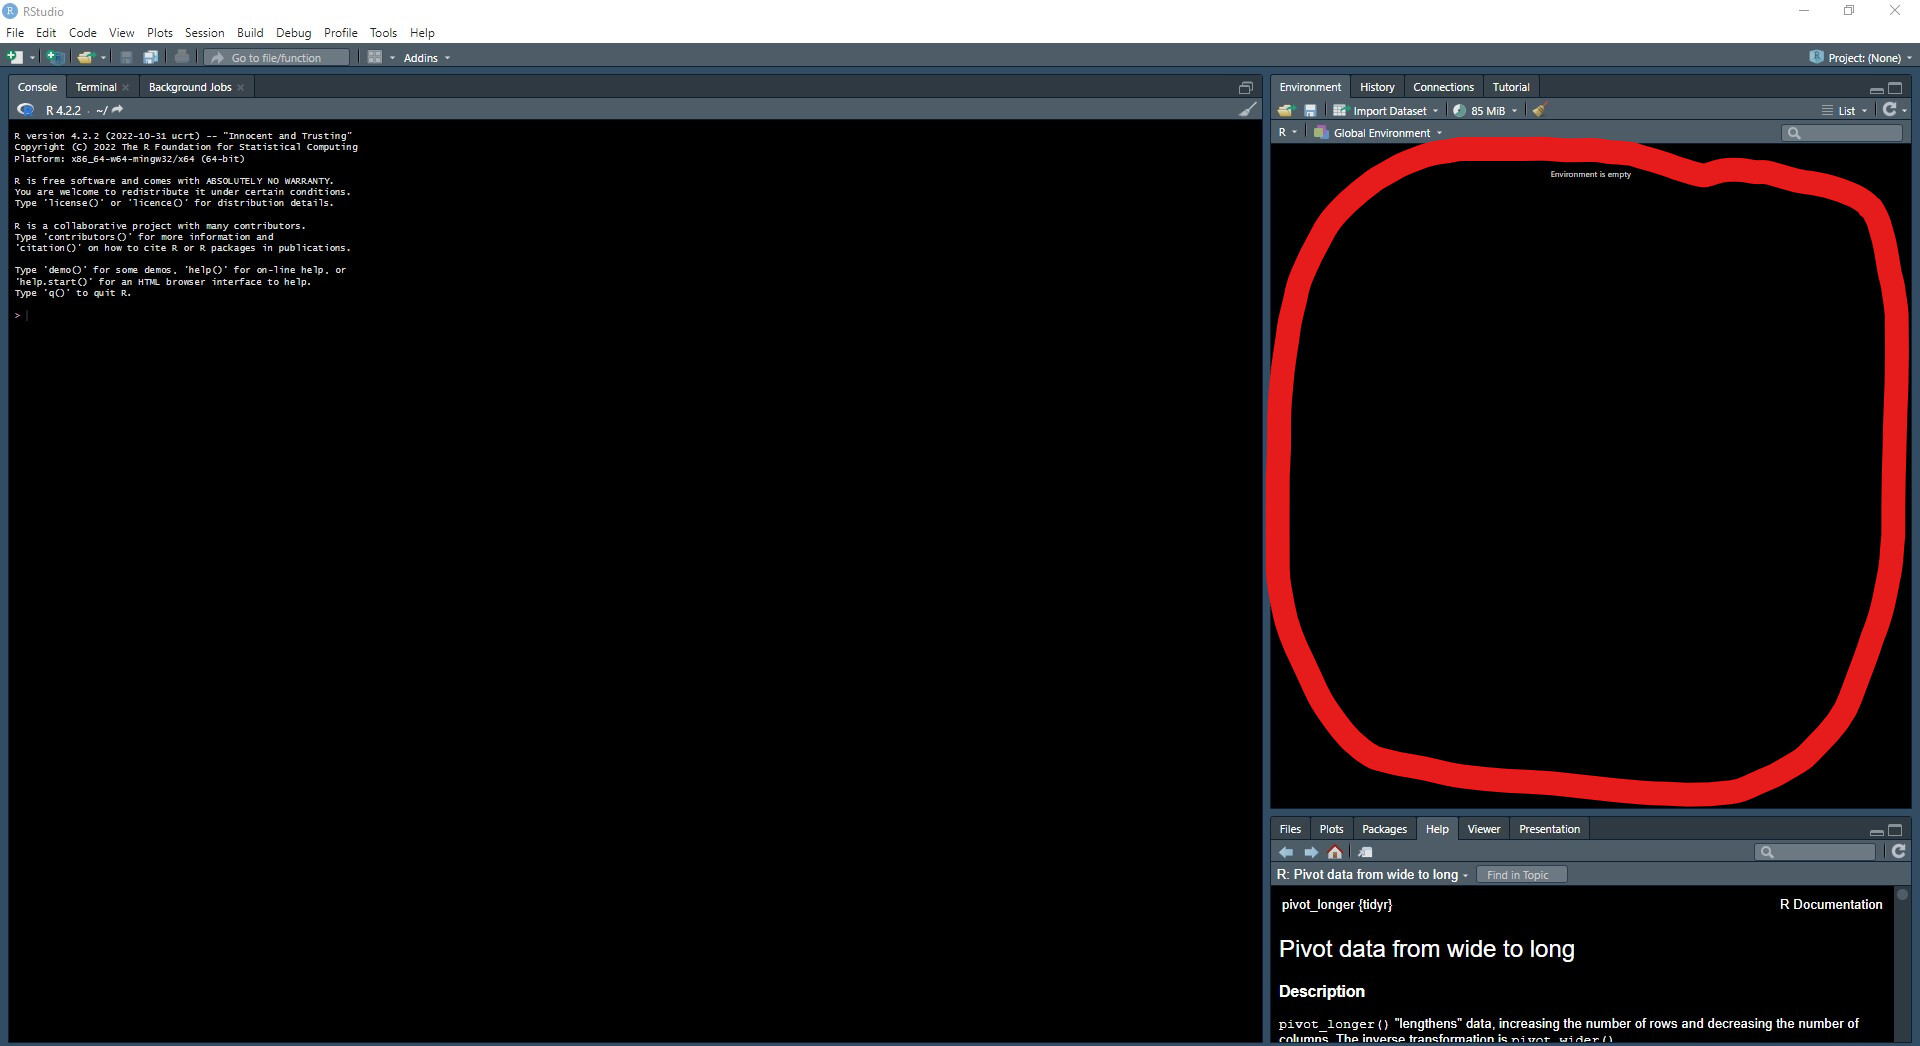
Is it possiple to display more than 1000 dataset in environment area that is red circled?(my qoestion is not about row or lines ) I create 1500 dataframe but can see just 1000 dataframe in environment area .
Hi friends,
Is it possiple to display more than 1000 dataset in environment area that is red circled?(my qoestion is not about row or lines ) I create 1500 dataframe but can see just 1000 dataframe in environment area .
There is certainly some limit, although I don't know what it is or where to look in the source code. But more than a screenful quickly becomes tedious to navigate. Instead create a data frame of names, locations and, if helpful, a brief description. Then you can search the data frame by name.
Would you give an example code of your recommendation... how can ı create df list as dataframe to reach them
Assume a folder in the working directory named data that contains 1,500 datasets saved as csv objects that it is desired to bring into namespace. A data frame suitable for a guidebook might look like
> # mydata is a directory under the current working directory
> # created in the terminal and populated with names of empty
> # files
> # inspect
> dir("mydata")
 [1] "a1.csv"  "b2.csv"  "c3.csv"  "d4.csv"  "e5.csv"  "f6.csv"  "g7.csv"
 [8] "h8.csv"  "i9.csv"  "j10.csv" "k11.csv" "l12.csv" "m13.csv" "n14.csv"
[15] "o15.csv" "p16.csv" "q17.csv" "r18.csv" "s19.csv" "t20.csv" "u21.csv"
[22] "v22.csv" "w23.csv" "x24.csv" "y25.csv" "z26.csv"
> # get names
> (dataname <- list.files("mydata", full.names = TRUE))
 [1] "mydata/a1.csv"  "mydata/b2.csv"  "mydata/c3.csv"  "mydata/d4.csv"
 [5] "mydata/e5.csv"  "mydata/f6.csv"  "mydata/g7.csv"  "mydata/h8.csv"
 [9] "mydata/i9.csv"  "mydata/j10.csv" "mydata/k11.csv" "mydata/l12.csv"
[13] "mydata/m13.csv" "mydata/n14.csv" "mydata/o15.csv" "mydata/p16.csv"
[17] "mydata/q17.csv" "mydata/r18.csv" "mydata/s19.csv" "mydata/t20.csv"
[21] "mydata/u21.csv" "mydata/v22.csv" "mydata/w23.csv" "mydata/x24.csv"
[25] "mydata/y25.csv" "mydata/z26.csv"
> # create data.frame of names
> (sets <- data.frame(dataset = dataname))
          dataset
1   mydata/a1.csv
2   mydata/b2.csv
3   mydata/c3.csv
4   mydata/d4.csv
5   mydata/e5.csv
6   mydata/f6.csv
7   mydata/g7.csv
8   mydata/h8.csv
9   mydata/i9.csv
10 mydata/j10.csv
11 mydata/k11.csv
12 mydata/l12.csv
13 mydata/m13.csv
14 mydata/n14.csv
15 mydata/o15.csv
16 mydata/p16.csv
17 mydata/q17.csv
18 mydata/r18.csv
19 mydata/s19.csv
20 mydata/t20.csv
21 mydata/u21.csv
22 mydata/v22.csv
23 mydata/w23.csv
24 mydata/x24.csv
25 mydata/y25.csv
26 mydata/z26.csv
> # borrow data to use as an example
> stuffing <- mtcars[1:26,]
> stuffing$model <- row.names(stuffing)
> row.names(stuffing) <- NULL
> stuffing <- stuffing[c(12,1:11)]
> # overwrite the empty file l12.csv
> write.csv(stuffing, file = sets[12,])
> # read it back in by rownumbe in data frame
> read.csv(sets[12,])[-1]
                 model  mpg cyl  disp  hp drat    wt  qsec vs am gear carb
1            Mazda RX4 21.0   6 160.0 110 3.90 2.620 16.46  0  1    4    4
2        Mazda RX4 Wag 21.0   6 160.0 110 3.90 2.875 17.02  0  1    4    4
3           Datsun 710 22.8   4 108.0  93 3.85 2.320 18.61  1  1    4    1
4       Hornet 4 Drive 21.4   6 258.0 110 3.08 3.215 19.44  1  0    3    1
5    Hornet Sportabout 18.7   8 360.0 175 3.15 3.440 17.02  0  0    3    2
6              Valiant 18.1   6 225.0 105 2.76 3.460 20.22  1  0    3    1
7           Duster 360 14.3   8 360.0 245 3.21 3.570 15.84  0  0    3    4
8            Merc 240D 24.4   4 146.7  62 3.69 3.190 20.00  1  0    4    2
9             Merc 230 22.8   4 140.8  95 3.92 3.150 22.90  1  0    4    2
10            Merc 280 19.2   6 167.6 123 3.92 3.440 18.30  1  0    4    4
11           Merc 280C 17.8   6 167.6 123 3.92 3.440 18.90  1  0    4    4
12          Merc 450SE 16.4   8 275.8 180 3.07 4.070 17.40  0  0    3    3
13          Merc 450SL 17.3   8 275.8 180 3.07 3.730 17.60  0  0    3    3
14         Merc 450SLC 15.2   8 275.8 180 3.07 3.780 18.00  0  0    3    3
15  Cadillac Fleetwood 10.4   8 472.0 205 2.93 5.250 17.98  0  0    3    4
16 Lincoln Continental 10.4   8 460.0 215 3.00 5.424 17.82  0  0    3    4
17   Chrysler Imperial 14.7   8 440.0 230 3.23 5.345 17.42  0  0    3    4
18            Fiat 128 32.4   4  78.7  66 4.08 2.200 19.47  1  1    4    1
19         Honda Civic 30.4   4  75.7  52 4.93 1.615 18.52  1  1    4    2
20      Toyota Corolla 33.9   4  71.1  65 4.22 1.835 19.90  1  1    4    1
21       Toyota Corona 21.5   4 120.1  97 3.70 2.465 20.01  1  0    3    1
22    Dodge Challenger 15.5   8 318.0 150 2.76 3.520 16.87  0  0    3    2
23         AMC Javelin 15.2   8 304.0 150 3.15 3.435 17.30  0  0    3    2
24          Camaro Z28 13.3   8 350.0 245 3.73 3.840 15.41  0  0    3    4
25    Pontiac Firebird 19.2   8 400.0 175 3.08 3.845 17.05  0  0    3    2
26           Fiat X1-9 27.3   4  79.0  66 4.08 1.935 18.90  1  1    4    1
>
Thanks my friend. I understand this solution but there is a Solution according to RSTUDIO IDE
As near as I can trace it through the tangle of Java, C++ and Electron code the limit is set
   private static final int MAX_LINES_DISPLAY = 500;
   private static final int MAX_LINES_OVERLOAD_BUFFER = 5000;
here, but I haven't touched Java since it was first in beta.
I may be missing the issue completely but is there any reason to display them as o posed to load them?
This is a big data and generated automatically between them so everyone give a birth a new dataset so ı got many dataframes... essential for calculation...
Nope, the Environment pane can't hold more than 1000 elements. If you need more than that, you might consider creating new environments to hold groups of elements (the Environment pane can show you those).
This topic was automatically closed 7 days after the last reply. New replies are no longer allowed.
If you have a query related to it or one of the replies, start a new topic and refer back with a link.