I see what you mean now, @nirgrahamuk - thanks.
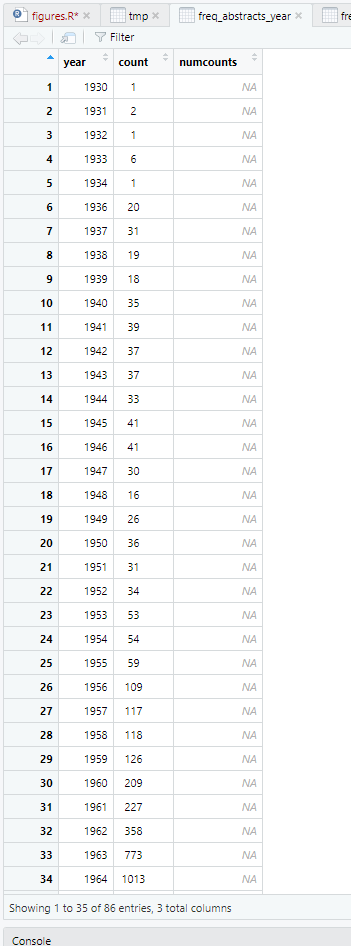
I ran the code you recommended above to yield a data frame with an extra column (numcounts) for what happens after the as.numeric transformation, and this is it:
(freq_abstracts_year$numcounts <- as.numeric(freq_abstracts_year$count))

(rows_where_bad <- na.action(na.omit(freq_abstracts_year)))

freq_abstracts_year[rows_where_bad,]

dput(freq_abstracts_year)
structure(list(year = c(1930, 1931, 1932, 1933, 1934, 1936, 1937,
1938, 1939, 1940, 1941, 1942, 1943, 1944, 1945, 1946, 1947, 1948,
1949, 1950, 1951, 1952, 1953, 1954, 1955, 1956, 1957, 1958, 1959,
1960, 1961, 1962, 1963, 1964, 1965, 1966, 1967, 1968, 1969, 1970,
1971, 1972, 1973, 1974, 1975, 1976, 1977, 1978, 1979, 1980, 1981,
1982, 1983, 1984, 1985, 1986, 1987, 1988, 1989, 1990, 1991, 1992,
1993, 1994, 1995, 1996, 1997, 1998, 1999, 2000, 2001, 2002, 2003,
2004, 2005, 2006, 2007, 2008, 2009, 2010, 2011, 2012, 2013, 2014,
2015, 2016), count = c(" 1", " 2", " 1", " 6",
" 1", " 20", " 31", " 19", " 18", " 35",
" 39", " 37", " 37", " 33", " 41", " 41",
" 30", " 16", " 26", " 36", " 31", " 34",
" 53", " 54", " 59", " 109", " 117", " 118",
" 126", " 209", " 227", " 358", " 773", " 1013", " 1301",
" 1274", " 1481", " 1914", " 1915", " 2402", " 2806", " 2944",
" 3618", " 3953", " 4512", " 5236", " 5596", " 6021", " 6318",
" 6757", " 7106", " 7455", " 7780", " 8169", " 8256", " 8935",
" 9158", " 9812", "11248", "11526", "11713", "12215", "12919",
"13823", "14680", "15754", "16085", "15468", "15479", "17021",
"17661", "18432", "19699", "21666", "22338", "25575", "28061",
"29130", "31238", "33273", "36172", "37883", "42136", "43907",
"45256", "53325"), numcounts = c(NA, NA, NA, NA, NA, NA, NA,
NA, NA, NA, NA, NA, NA, NA, NA, NA, NA, NA, NA, NA, NA, NA, NA,
NA, NA, NA, NA, NA, NA, NA, NA, NA, NA, NA, NA, NA, NA, NA, NA,
NA, NA, NA, NA, NA, NA, NA, NA, NA, NA, NA, NA, NA, NA, NA, NA,
NA, NA, NA, 11248, 11526, 11713, 12215, 12919, 13823, 14680,
15754, 16085, 15468, 15479, 17021, 17661, 18432, 19699, 21666,
22338, 25575, 28061, 29130, 31238, 33273, 36172, 37883, 42136,
43907, 45256, 53325)), row.names = c(NA, -86L), class = c("tbl_df",
"tbl", "data.frame"))
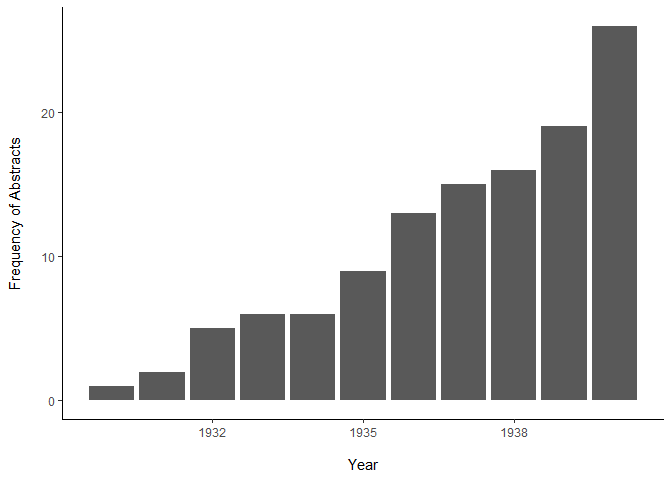
image1:
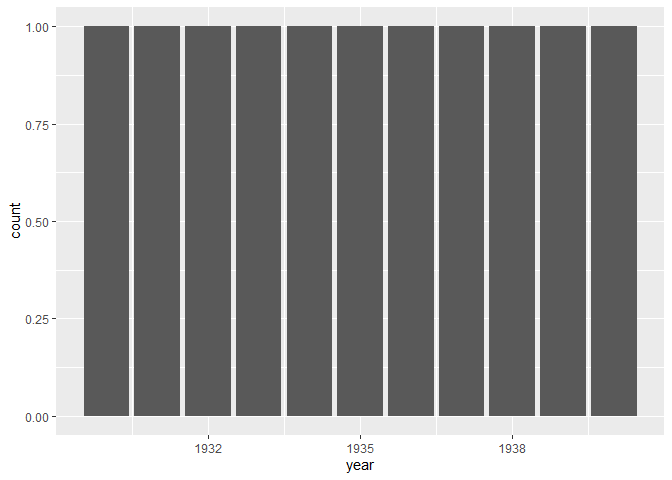
image2: