Looking for a computational approach for a problem in network data.

Hi, I have a communication network between two tissues. Each node in the network has an attribute of correlation with some phenotype(gene expression with BMI). Some node has a quite positive and negative correlation with BMI, and some have a low correlation with BMI. Therefore, in the communication network, some neighbouring nodes (positive nodes) interact with negative nodes. Additionally, negative nodes interact with positive nodes. Biologically, this kind of interaction may not make sense, as positive nodes are only expressed when BMI increase and negative nodes are expressed when BMI is low. Therefore, to make this network meaningful, I want to lower those nodes with a positive correlation with BMI closer to zero; therefore, interaction with a negative node makes sense biologically. The same is true for the other round. However, I don't know how to formulate and code it in R? Additionally, I am wondering if my approach would make sense. Thank you for the help.

Below is the R script for you to understand what I mean.
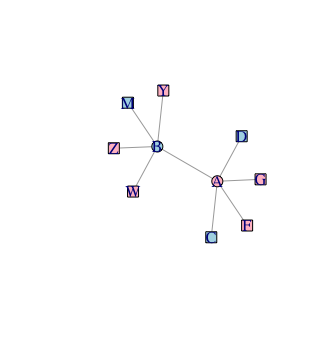
network data

g <- data.frame(source =  rep(c("A","B"),c(5,4)), 
                target= c("D","C","G","F","B",
                          "W","Z","Y","M"))
g <- graph_from_data_frame(g, directed = F)

node attribuate(corrlation between gene expression and BMI)

node= c(0.3,-0.3,-0.9,-0.6,0.8,0.9,0.5,0.5,0.7,-0.4)
g <- set_vertex_attr(g, "BMI", value = node)

colours represent gene's correlation to BMI

V(g)$color <- ifelse(V(g)$BMI > 0,"red", "lightblue")

Shapes represent tissue

V(g)$shape <- ifelse(names(V(g)) %in% c("A","B"), shapes()[1], shapes()[9])
plot(g)

how much closer to zero ? by what method ?
you can directly adjust all the positive node values to be smaller (like halving them; just like this)

 node <- ifelse(node>0,node/2,node)

before you add them to g via set_vertex_attr

@nirgrahamuk, Thanks for the answer. Yes, I already tried that and I want to a way to use some threshold to decrease or increase values. Rather want to try some sort of statistical modelling or approach to the problem.

sounds like you are asking more of a biology question than an R question then ?

a biological problem in network data using R :grinning:
Sure it's not code related problem.

What is usually much more difficult that how. Your plot can help refine the question of what question the data is to address.

image

This represents a graph object in which each node is connected to each other mode bidirectionally directly or within two or three degrees.

Attributes of nodes fall into the two classes of tissues (A&B, shown with the round shape) and genes (the remaining nodes, shown with the square shape).

The edges (termed "vertices" by igraph) are connections between nodes that have attributes reflecting a numeric expression of an association with BMI.

Underspecified in the statement of the problem is the directionality of the edges. When we say that a tissue and gene are associated with respect to BMI, does that imply that there is also an association between the gene and the tissue with some unspecified attribute of the gene? A graph object can be directional or nondirectional. A directional graph object can be unidirectional or bidirectional.

Also, what is the nature of the association between the two tissue nodes. Does the association between A & C carry over to the association between B & Y—is the association between one pair of tissues/genes different depending on the association between the other pair?

Fundamental to this all is

What do these measurements expressed in network form tell us in terms of BMI that we don't already know from having derived measures of association?

@technocrat , Thank you for your feedback. I made a mistake in the code. Node B should not be present in the target column. Therefore nodes A and B, shown by a round shape, should represent genes expressed in Tissue1 and got a correlation with BMI(c(0.3 and -0.3), respectively). The rest of the nodes(c("D", "C", "G", "F", "W", "Z", "Y", "M" )) represented by square nodes are genes expressed in Tissue2, and each gene got a correlation with BMI(c(-0.9,-0.6,0.8,0.9,0.5,0.5,0.7,-0.4)). Thus, here simply you see the correlation of tissue-specific gene expression with BMI.

Now, let us assume we have evidence about the interaction between genes from Tissue1 and the genes from Tissue2. Although we have evidence about the interaction, according to the data(network), for example, there should not be an interaction between nodes A and D because Node A expressed in Tissue1 when the BMI of the individual increase, and D is expressed in Tissue2 when BMI is decreasing. Therefore, there is no way for both nodes to interact because both nodes are expressed under different states.

Therefore I was asking what approach I should follow to ensure that both nodes are represented relatively in a similar state without losing the variabilities present in the nodes. This means keeping the difference but putting both nodes in either positive or negative states. Then, I could say both nodes are communicating despite the difference they have with BMI.

g <- data.frame(source =  rep(c("A","B"),c(5,4)), 
                target= c("D","C","G","F",
                          "W","Z","Y","M","W"))
g <- graph_from_data_frame(g, directed = F)
node_cor_BIM = c(0.3,-0.3,-0.9,-0.6,0.8,0.9,0.5,0.5,0.7,-0.4)
g <- set_vertex_attr(g, "BMI", value = node_cor_BIM)
V(g)$color <- ifelse(V(g)$BMI > 0,"red", "lightblue")
V(g)$shape <- ifelse(names(V(g)) %in% c("A","B"), shapes()[1], shapes()[9])
plot(g)

Thanks!

Still not detecting a concrete technical requirement to do x with y.
This seems to be a ' i dont know what to do because I have conflicting data, and I want to manipulate some data to conform to the other but I dont know how I would do that in a principled way'.

Therefore, my advice is you should seek expert knowledge not from the general R community, but some subject area expert who can tell you if there is anything to do here. If such an expert happens to not know R but can explain in computational/mathematical terms what to do, then as programmers we could use that as a basis to program from...

If I have misread you and you could say what all the numbers should be node_cor_BIM , what the finished network should be like in contrast to your starting network, not in a qualitive handwavy way, but in a concrete quantitative way and you can be explicit about it, then by all means proceed with that information, and we can have a go.

This topic was automatically closed 42 days after the last reply. New replies are no longer allowed.

If you have a query related to it or one of the replies, start a new topic and refer back with a link.