map with highcharter is not appearing

Hi everyone,

I would like to plot a map from a part of Germany. My code is not plotting the map. It is only plotting the title.
This is the code:

library(highcharter)

# Fetch the map data for Germany
map_data <- "https://code.highcharts.com/mapdata/countries/de/de-all.geo.json"

# Prepare the demo data
data <- data.frame(
  id = c('DE-SL', 'DE-BY', 'DE-BW', 'DE-BB', 'DE-MV', 'DE-SN'),
  value = c(136, 120, 169, 109, 137, 109)
)

# Create the chart
highchart(type = "map") %>%
  hc_title(text = "Highcharts Maps basic demo") %>%
  hc_subtitle(text = 'Source map: Germany') %>%
  hc_colorAxis(min = 0) %>%
  hc_mapNavigation(enabled = TRUE) %>%
  hc_add_series(data = data, mapData = map_data, joinBy = "hc-key", name = "Random data",
                value = "value", dataLabels = list(enabled = TRUE, format = "{point.name}")) %>%
  hc_plotOptions(
    map = list(
      states = list(
        hover = list(
          color = "#BADA55"
        )
      )
    )
  )


or another code that i tried is:

library(plotly)
library(jsonlite)

# Fetch the map data
topology <- jsonlite::fromJSON('https://code.highcharts.com/mapdata/countries/de/de-sl-all.topo.json')

# Prepare the demo data
data <- data.frame(
  id = c('de-sl-10042000', 'de-sl-10043000', 'de-sl-10044000', 'de-sl-10041000', 'de-sl-10045000', 'de-sl-10046000'),
  value = c(136, 120, 169, 109, 137, 109)
)

# Create a plotly choropleth map
plot_ly(
  type = "choropleth",
  locationmode = "ISO-3",
  locations = data$id,
  z = data$value,
  colorscale = "Viridis",
  text = data$id,
  hoverinfo = "text",
  marker = list(line = list(color = "rgb(255,255,255)", width = 1))
) %>%
  add_trace(
    type = "choropleth",
    locations = data$id,
    z = data$value,
    text = data$id,
    hoverinfo = "text",
    showscale = FALSE
  ) %>%
  layout(
    title = "Plotly Choropleth Map",
    geo = list(scope = "world", resolution = 50, showframe = FALSE, showcoastlines = FALSE)
  )


Any idea where the problem could be?

Thanks in advance
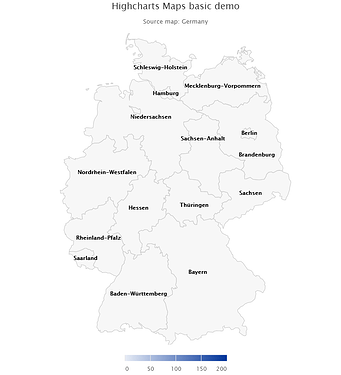
It looks like map_data is the link to the data, but not the data itself. Use the httr package to get the data by adding the following.

library(highcharter)
library(httr)

# Fetch the map data for Germany
map_data <- "https://code.highcharts.com/mapdata/countries/de/de-all.geo.json"
map_data = content(GET(map_data))

Thanks Scottyd22.
I amended the code with your suggestion. Now is plotting the map of Germany, but is not plotting Saarland with the incidenc rates that i wanted.

I did: ```{r}
library(highcharter)

library(highcharter)
library(httr)

Fetch the map data for Germany

map_data <- "https://code.highcharts.com/mapdata/countries/de/de-all.geo.json"
map_data = content(GET(map_data))

Fetch the map data for Germany

map_data <- "https://code.highcharts.com/mapdata/countries/de/de-all.geo.json"

Prepare the demo data

data <- data.frame(
id = c('DE-SL', 'DE-BY', 'DE-BW', 'DE-BB', 'DE-MV', 'DE-SN'),
value = c(136, 120, 169, 109, 137, 109)
)

Create the chart

highchart(type = "map") %>%
hc_title(text = "Highcharts Maps basic demo") %>%
hc_subtitle(text = 'Source map: Germany') %>%
hc_colorAxis(min = 0) %>%
hc_mapNavigation(enabled = TRUE) %>%
hc_add_series(data = data, mapData = map_data, joinBy = "hc-key", name = "Random data",
value = "value", dataLabels = list(enabled = TRUE, format = "{point.name}")) %>%
hc_plotOptions(
map = list(
states = list(
hover = list(
color = "#BADA55"
)
)
)
)


but i wanted to plot this data:
data <- data.frame(
  id = c('DE-SL', 'DE-BY', 'DE-BW', 'DE-BB', 'DE-MV', 'DE-SN'),
  value = c(136, 120, 169, 109, 137, 109)

This is only Saarland not the whole Germany.

Sorry if I confused you, as I earlier said Germany..

Do you know how could I amend the code to plot Saarland with the incidences?

Thanks very much in advance

Best

Hi @tacoba, unfortunately, I'm not quite sure how to subset to only Saarland. Hopefully someone else can jump in and offer a solution.

This topic was automatically closed 42 days after the last reply. New replies are no longer allowed.

If you have a query related to it or one of the replies, start a new topic and refer back with a link.