I have a dataset of tweets with locations for some rows, but the location column has data in different formats, Cities, Countries, and abbreviations. There is no latitude or longitude. How can I map them?
Hi @Donya,
What you need is to geolocate your place names. There are various ways to do this but using the Open Street Map database is free and does not require an API key (unlike Google Maps).
The more information in the location string the better. Here is a made-up example including some inaccurate geolocation look-ups.
# Open Street Map database
# See: https://www.supplychaindataanalytics.com/geocoding-with-osmdata-in-r/
library(osmdata)
#> Data (c) OpenStreetMap contributors, ODbL 1.0. https://www.openstreetmap.org/copyright
library(ggplot2)

df <- data.frame(tweet = c("Elon Musk's done what?",
                           "Vote, just vote",
                           "Snowing here today",
                           "Mastodon Rules OK",
                           "My name is Eric",
                           "I live on an island"),
                 location = c("London","Cairo","Australia","USA","Chile","St Helena"))


# using getbb() function to geocode locations
# This function actually gets a "bounding box" centered on the location.
# The box limits are used to find the centre which should ~= the location GPS.
for(i in 1:nrow(df)){
  coordinates = getbb(df$location[i])
  df$long[i] = (coordinates[1,1] + coordinates[1,2])/2
  df$lat[i] = (coordinates[2,1] + coordinates[2,2])/2
}

df
#>                    tweet  location        long        lat
#> 1 Elon Musk's done what?    London  -0.0881798  51.489317
#> 2        Vote, just vote     Cairo  31.2357257  30.044388
#> 3     Snowing here today Australia 152.5551371 -31.952622
#> 4      Mastodon Rules OK       USA 131.3321250  33.503101
#> 5        My name is Eric     Chile -61.8528182   7.307069
#> 6    I live on an island St Helena  -5.7129442 -15.969457

# Draw a world map
world_map <- map_data("world")
# Create a base plot with ggplot2
p <- ggplot() + coord_fixed() +
       xlab("") + ylab("")

# Add map to base plot
base_world <- p + geom_polygon(data=world_map, aes(x=long, y=lat, group=group),
                               colour="gray65", fill= "gray65")

# Add data points to map (NOT all are accurate)
map_data <-
  base_world +
    geom_point(data=df, aes(x=long, y=lat), size=4)

map_data
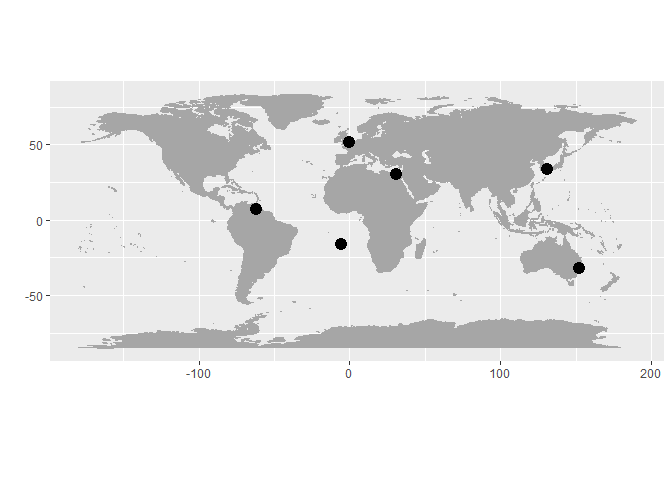
# Results can be mis-leading if location information is insufficient
getbb("Chile")
#>          min        max
#> x -61.865763 -61.839874
#> y   7.294831   7.319306
getbb("Santiago, Chile")
#>         min       max
#> x -70.69205 -70.62500
#> y -33.47857 -33.42559
Created on 2022-11-08 with reprex v2.0.2
1 Like
Thank you so much. That worked. Thanks
I have another question. Unfortunately, I have two columns, one for the country and one for area_name, and I need to map different places, so countries alone won't work, but some of the rows have "nationwide" instead of the real value. How can I use the country in case their area column has the value of "nationwide."? Thanks for your help
This topic was automatically closed 21 days after the last reply. New replies are no longer allowed.
If you have a query related to it or one of the replies, start a new topic and refer back with a link.