Hi All,
I been cracking my brain to get this right and hopefully I can get different ways to do it.
Here is a subset of my data :
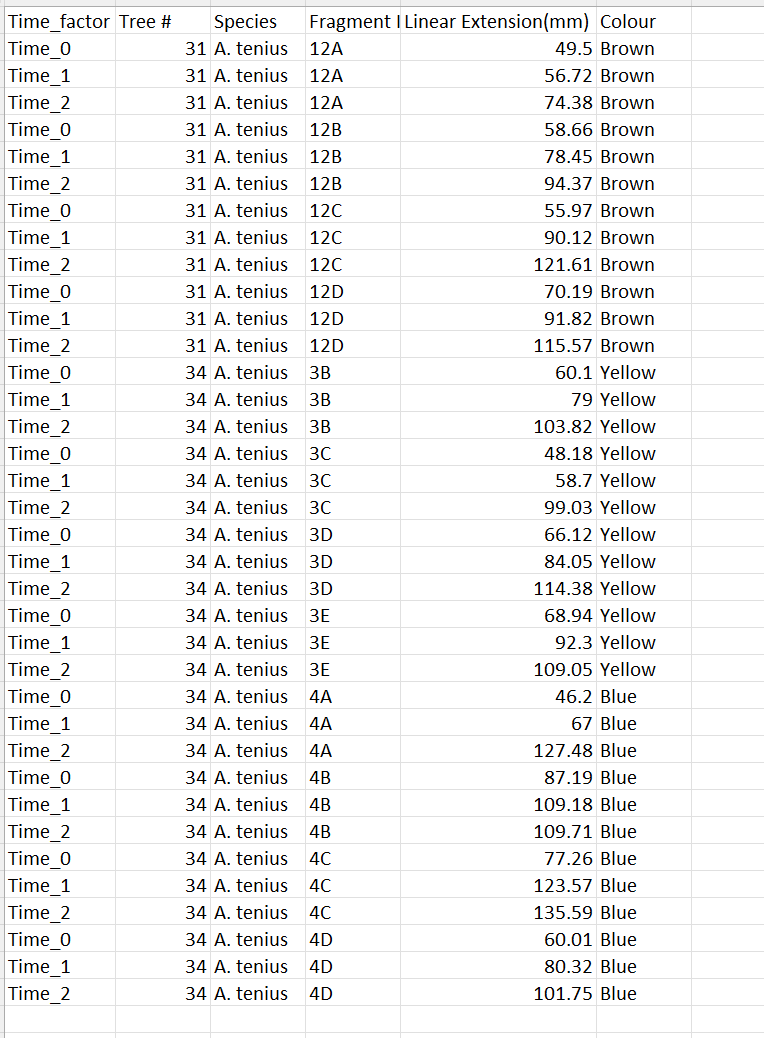
So the variable that i want are time factor, color and linear extension. I wanted to create a column to get mean of the net linear extension of each color by time factor. SO it will be yellow's mean linear extension at time 2 subtract yellow's mean linear extension at time 1. Then yellow's mean linear extension at time 1 subract time 0. So to get the difference.
This is what I did -
script :
library(ggplot2)
library(rlang)
attach(data1)
library(FSA)
library(dplyr)
attach(colormorph)
sum = Summarize(Linear.Extension.mm.~ Time_factor + Colour)
sum$se = sum$sd / sqrt(sum$n)
sum # # to get the mean
ON CONSOLE -
Time_factor Colour n nvalid mean sd min Q1 median Q3 max
1 Time_0 Blue 15 15 75.19400 15.84137 46.20 67.5800 75.10 77.6950 118.29
2 Time_1 Blue 15 15 91.82333 17.40502 67.00 78.7550 87.94 104.3500 123.57
3 Time_2 Blue 15 15 116.15533 18.38197 92.37 103.3100 109.71 127.2450 152.37
4 Time_0 Brown 20 20 69.48950 11.81186 49.50 59.7250 69.28 80.7250 88.06
5 Time_1 Brown 20 20 83.55600 14.57220 56.72 73.6475 84.70 92.3575 108.75
6 Time_2 Brown 20 19 103.41211 22.14756 63.50 89.7200 99.14 122.7500 144.36
7 Time_0 Yellow 15 15 69.56000 11.21474 48.18 64.4100 67.14 74.0550 93.30
8 Time_1 Yellow 15 15 91.40667 17.94788 58.70 81.4550 89.81 97.5900 128.26
9 Time_2 Yellow 15 15 118.70533 20.45002 95.28 103.6850 114.38 125.0550 163.88
se
1 4.090223
2 4.493957
3 4.746204
4 2.641212
5 3.258443
6 4.952344
7 2.895632
8 4.634123
9 5.280173
Script :
colormorphdata %>%
group_by(Colour) %>%
arrange(Time_factor) %>%
mutate(netTLE = mean - lag(mean, default= first(mean)))
-- this is where i got stuck
I am wondering if anyone got any other way to calculate the difference in mean? Do I have to create a new mean column.
Thanks in advance!