I have the following 8 plots have been made beforehand and saved as HTML files in my working directory:
library(plotly)

Red_A <- data.frame(var1 = rnorm(100,100,100), var2 = rnorm(100,100,100)) %>%
  plot_ly(x = ~var1, y = ~var2, marker = list(color = "red")) %>%
  layout(title = 'Red A')

Red_B <- data.frame(var1 = rnorm(100,100,100), var2 = rnorm(100,100,100)) %>%
  plot_ly(x = ~var1, y = ~var2, marker = list(color = "red")) %>%
  layout(title = 'Red B')

Blue_A <- data.frame(var1 = rnorm(100,100,100), var2 = rnorm(100,100,100)) %>%
  plot_ly(x = ~var1, y = ~var2, marker = list(color = "blue")) %>%
  layout(title = 'Blue A')

Blue_B <- data.frame(var1 = rnorm(100,100,100), var2 = rnorm(100,100,100)) %>%
  plot_ly(x = ~var1, y = ~var2, marker = list(color = "red")) %>%
  layout(title = 'Blue B')

htmlwidgets::saveWidget(as_widget(Red_A), "Red_A.html")
htmlwidgets::saveWidget(as_widget(Red_B), "Red_B.html")
htmlwidgets::saveWidget(as_widget(Blue_A), "Blue_A.html")
htmlwidgets::saveWidget(as_widget(Blue_B), "Blue_B.html")
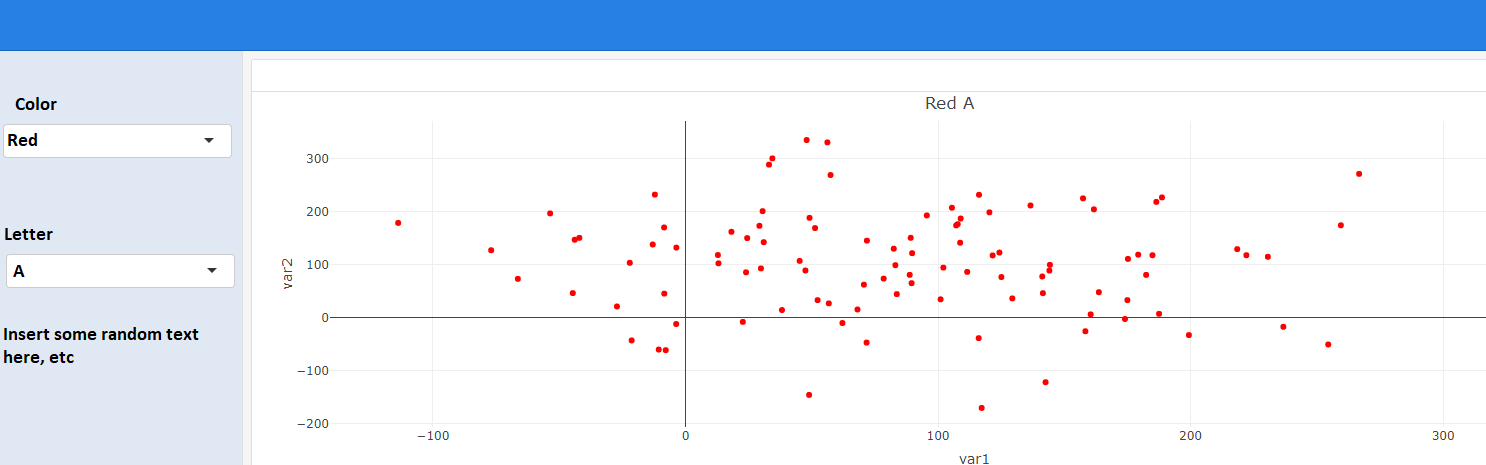
My Question: Using this template over here (https://testing-apps.shinyapps.io/flexdashboard-shiny-biclust/) - I would like to make a flexdashboard that allows the user to select (from two dropdown menus) a "color" and a "letter" - and then render one of the corresponding graphs (e.g. col = Red & letter = B -> "Red B"). I would then like to be able to save the final product itself as an HTML file. This would look something like this:
I tried to write the Rmarkdown Code for this problem by adapting the tutorial:
    ---
    title: "Plotly Graph Selector"
    output:
      flexdashboard::flex_dashboard:
        orientation: columns
        vertical_layout: fill
    runtime: shiny
---

Inputs {.sidebar}
 selectInput("Letter", label = h3("Letter"),
    choices = list("A" = 1, "B" = 2),
    selected = 1)

 selectInput("Color", label = h3("Color"),
    choices = list("Red" = 1, "Blue" = 2),
    selected = 1)
But I am not really sure how to continue with this.
Can someone please help me out?
Thanks!
Note: I know that it is possible to load HTML files into a dashboard that have been made beforehand, e.g.
<object class="one" type="text/html" data="Red_A.html"></object>
<object class="one" type="text/html" data="Red_B.html"></object>
<object class="one" type="text/html" data="Blue_A.html"></object>
<object class="one" type="text/html" data="Blue_B.html"></object>