movable lines in plot

Hi

I am trying to add movable lines to my plots in shiny. I did find this example that works well:

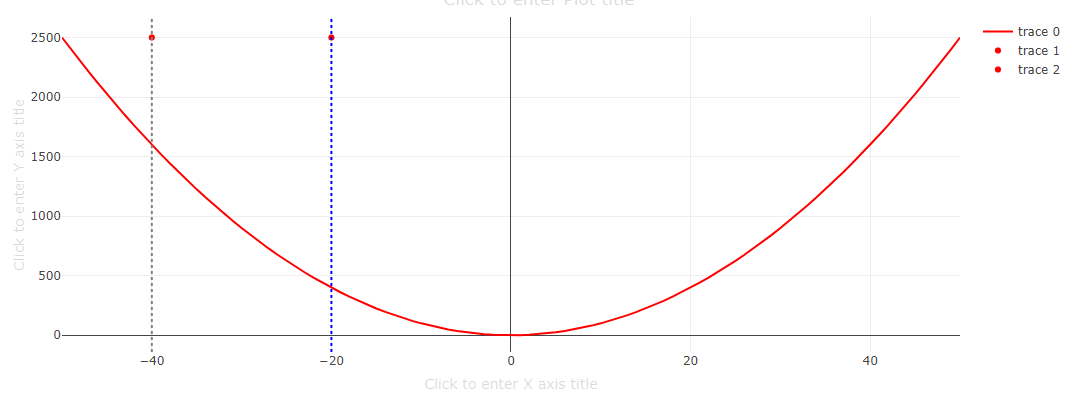
Now I want to be able to add two or more lines to the plot, so I adapted the code, but I am only able to see one.

Here is my code :

library(shiny)
library(plotly)
ui <- fluidPage(
  plotlyOutput("new_plot")
)

server <- function(input, output, session) {
  s <-reactive({
    
    rv <- reactiveValues(x = NULL, y = NULL)
    
    rv$x <- as.vector(-50:50)
    rv$y <- as.vector(rv$x^2)
    
    d <- event_data("plotly_relayout", source = "trajectory")
    
    selected_point <- if (!is.null(d[["shapes[0].x0"]])) {
      xint <- d[["shapes[0].x0"]]
      xpt <- rv$x[which.min(abs(rv$x - xint))]
      list(x = xpt, y = rv$y[which.min(abs(rv$x - xint))])
    } else {
      list(x = -40, y = rv$y[which(rv$x == min(rv$x))])
    }
    
    d2 <- event_data("plotly_relayout", source = "trajectory")
    
    selected_point2 <- if (!is.null(d2[["shapes[0].x0"]])) {
      xint <- d2[["shapes[0].x0"]]
      xpt <- rv$x[which.min(abs(rv$x - xint))]
      list(x = xpt, y = rv$y[which.min(abs(rv$x - xint))])
    } else {
      list(x = -20, y = rv$y[which(rv$x == min(rv$x))])
    }
    
    print(selected_point)
    
    
    plot_ly(color = I("red"), source = "trajectory") %>%
      add_lines(x = rv$x, y = rv$y) %>%
      add_markers(x = selected_point$x, y = selected_point$y) %>%
      layout(
        shapes = list(
          type = "line", 
          line = list(color = "gray", dash = "dot"),
          x0 = selected_point$x, 
          x1 = selected_point$x,
          y0 = 0,
          y1 = 1,
          yref = "paper"
        )
      ) %>%
      add_markers(x = selected_point2$x, y = selected_point2$y) %>%
      layout(
        shapes = list(
          type = "line", 
          line = list(color = "blue", dash = "dot"),
          x0 = selected_point2$x, 
          x1 = selected_point2$x,
          y0 = 0,
          y1 = 1,
          yref = "paper"
        )
      ) %>%
      
      config(editable = TRUE)
  })
  
  output$new_plot <- renderPlotly({
    s()
  })
}

shinyApp(ui = ui, server = server)

Many thanks !

Welcome to the community @Felipe3! Based on some experimentation, I found the lines will appear if you put both of them within shapes = list(), making a"list of lists".

plot_ly(color = I("red"), source = "trajectory") %>%
      add_lines(x = rv$x, y = rv$y) %>%
      add_markers(x = selected_point$x, y = selected_point$y) %>%
      add_markers(x = selected_point2$x, y = selected_point2$y) %>%
      layout(
        shapes = list(
          list(type = "line", 
               line = list(color = "gray", dash = "dot"),
               x0 = selected_point$x, 
               x1 = selected_point$x,
               y0 = 0,
               y1 = 1,
               yref = "paper"),
          list(type = "line",
               line = list(color = "blue", dash = "dot"),
               x0 = selected_point2$x,
               x1 = selected_point2$x,
               y0 = 0,
               y1 = 1,
               yref = 'paper')
        )
      ) %>%
      config(editable = T)

1 Like

Thanks Scotty for your answer . Try the code and I am able to see the lines, but when I try to move them, they come back to their original position. Any idea on how to solve that ?

Many thanks !

You're welcome, and I noticed that too. I think it may have something to do with the "plotly_relayout" specification, but I'm not familiar with the event_data() function. Maybe someone with more experience in this area can provide guidance on the issue.

This topic was automatically closed 21 days after the last reply. New replies are no longer allowed.

If you have a query related to it or one of the replies, start a new topic and refer back with a link.