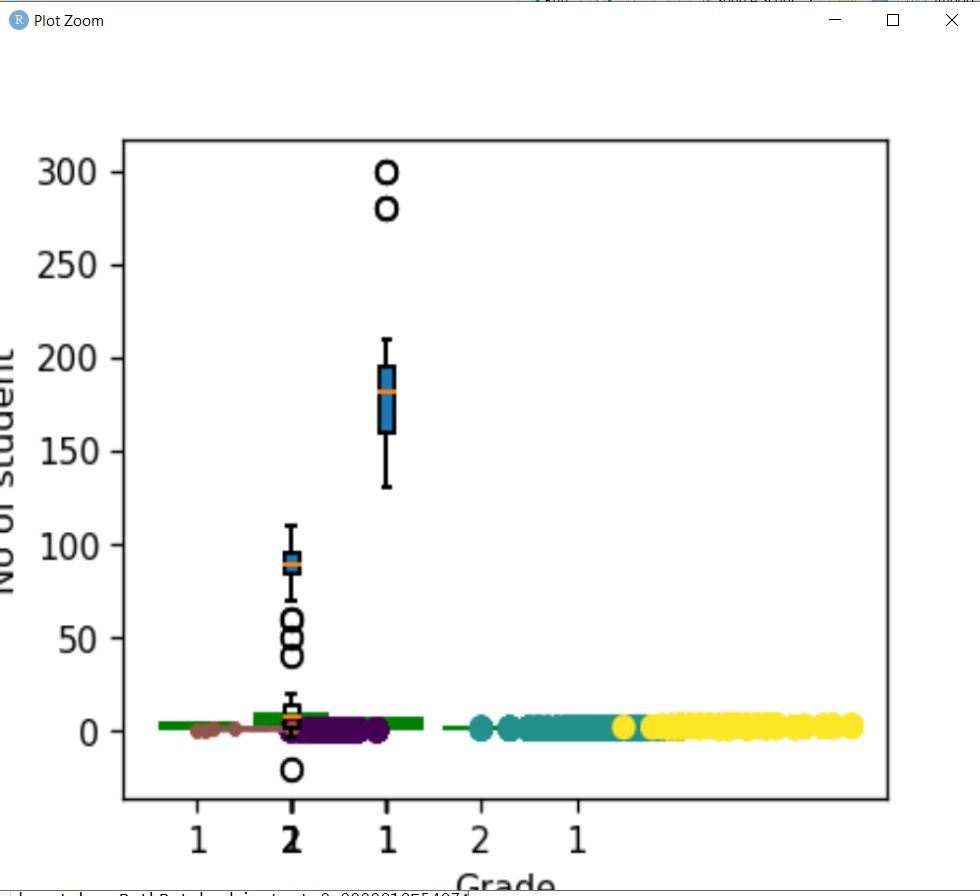
i run these python codes in Rstudio but plots show in one plot like uploaded picture
#first code
iris = datasets.load_iris()
df = pd.DataFrame(iris.data, columns=iris.feature_names)
df['class']= iris.target
x=iris.data[:,[2,3]]
y=iris.target
plt.scatter(x[:,0],x[:,1],c=y)
plt.show()
#second code
grade = ['A', 'B', 'C', 'D', 'E']
n = [ 5, 10,  8,  3 , 2]
k=[0,1,2,3,4]
plt.bar(k,n,color='green')
plt.xlabel('Grade')
plt.ylabel('No of student')
a=plt.xticks(k, grade)
plt.show()
#third code
class1= np.array([60,70,80,83,85,87,88,89,90,92,94,95,97,100,110])
class2 = np.array([130,143,150,158,160,170,175,182,185,188,190,200,210,280,300])
plt.boxplot([class1,class2],patch_artist=True)
plt.show()
how can i draw each plot in separate plot?
output figs